Variable data vectors
96 variable data vector illustrations picked from 15.7M royalty-free files, with no more than 3 per artist so you see real variety. Every file is a scalable EPS that opens in Illustrator, CorelDRAW, Affinity Designer and Inkscape, and exports to SVG or PNG at any size.
-
 Vector statistical icons of correlation types. Positive, negative, no correlation. The relationship between two data sets or two random variables. Graphs or charts.
-
 100 ui outline icons set such as web crawler, 3d data analytics dual bars, data search for interface, bars and line ascending of data analytics, analysis pie chart interface, multiple variable
-
 Infographic template design with user interface icons. timeline concept with 7 options or steps. included brainstorming, reload pie chart, multiple variable bars data, writing square, binary data
-
 Set of 40 flat user interface web icons in line style such as multiple variable lines, connected data flow chart, smiles, hidden, table for data, data collection, footprints direction sketch icons
-
 Set of scatter plot diagrams. Scattergrams with different types of variables correlation. Data points plotted on a horizontal and a vertical axis on Cartesian plane. Vector flat illustration
-
 Set of scatter plot diagrams. Scattergrams with different types of variables negative correlation. Data points plotted on a horizontal and a vertical axis on Cartesian plane. Vector flat illustration
-
 NTP Network Time Protocol - networking protocol for clock synchronization between computer systems over packet-switched, variable-latency data networks, acronym text concept background
-
 Multiple variable bars data outline icon in white and black colors. multiple variable bars data flat vector icon from user interface collection for web, mobile apps and ui.
-
 Infographic template with icons and 8 options or steps. infographic for user interface concept. included multiple variable lines, uploading file, increasing data, humans, user ting interface, grid
-
 Infographic template design with user interface icons. timeline concept with 7 options or steps. included data analytics tings, multiple variable continuous chart, box plot chart interface, 3d data
-
 Multiple variable bars data outline vector icon. Thin line black multiple variable bars data icon, flat vector simple element illustration from editable user interface concept isolated on white
-
 Two color multiple variable bars data vector icon from user inte
-
 Infographic template with icons and 7 options or steps. infographic for user interface collection. concept. included hidden, user data analytics, cube of squares, multiple variable lines, dual
-
 User interface infographic design template with dual bars interface, multiple variable vertical bars, stream, data search for interface, searching tings data writing board pie chart analysis 3d data
-
 Data indicators metrics. Statistics variable, measurable information of outcomes vector monocolor illustration
-
 Outline multiple variable bars data vector icon. isolated black simple line element illustration from user interface concept. editable vector stroke multiple variable bars data icon on white
-
 Data analytics icons including mining, machine learning, decision making, database, business intelligent, science, bar, line graph, scatter plot, histogram, pie chart, box, pyramid, average, variability, random sampling, frequency table, cluster
-
 Data analytics icons including scatter plot, scramble system, secure backup, shared web hosting, software developer, statistics, structure, update, timeline chart, unstructured, user analysis, variability.
-
 Security Assessment System for Big Data Servers
-
 Control variables blue gradient concept icon. Business tests. Causal research changeable and principles abstract idea thin line illustration. Isolated outline drawing. Myriad Pro-Bold font used
-
 Dependent variables blue gradient concept icon. Causal research changeable and principles abstract idea thin line illustration. Isolated outline drawing. Myriad Pro-Bold font used
-
 Independent variables blue gradient concept icon. Causal research changeable and principles abstract idea thin line illustration. Isolated outline drawing. Myriad Pro-Bold font used
-
 API Application Programming Interface with Laptop, Pencil, Cloud Data
-
 India infographic with 3D bar and pie chart, increasing values, India country flag on 3D bar graph, ups and downs data, presentation graphic idea, developing country
-
 Gaus chart with different height columns. Normal distribution graph. Bell shaped curve template for statistics or logistic data. Probability theory math function. Vector flat illustration
-
 Longitudinal study compare to Cross-sectional study for observe subject data with different period of time
-
 Mexico 3D bar chart graph with ups and downs, increasing values, Mexico country flag on 3D bar graph, upward rising arrow on data, news banner idea, developing country concept
-
 Correlation is a statistical measure that expresses the extent to which two variables are linearly related
-
 Independent variable with control variable to see dependent variable of the experiment
-
 Vector warped lines background. Flexible stripes twisted as silk forming volumetric folds. Colorful variable width stripes with shadows and highlights. Vector illustration
-
 Set of user interface web icons in outline style. thin line icons such as writing square, reload pie chart, multiple variable lines, upload up, documents with a star, bars chart page, loading
-
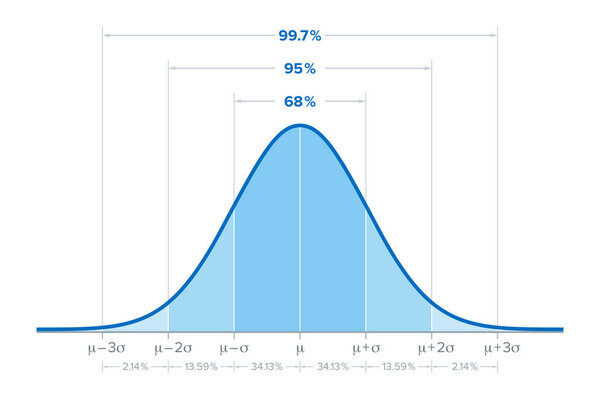 The standard deviation, sometimes called bell curve, describes the amount of variation in a data set by measuring and averaging, how much each value in the data set varies from the calculated mean.
-
 Standard normal distribution, also Gaussian distribution or bell curve. Used in statistics and in natural and social sciences to represent real-valued random variables of unknown distributions. Vector
-
 Cambodia infographic with 3D bar and pie chart, increasing values, Cambodia country flag on 3D bar graph, ups and downs data, presentation graphic idea, developing country
-
 Energy demand or electricity consumption with increased price outline concept. Power market analytic and forecasting with expensive peak hours vector illustration. Financial diagram with supply data.
-
 Set of 24 outline web market research icons such as cost, focus group, interview, eye tracking, public opinion, independent variable, targeting vector icons for report, presentation, diagram, web
-
 Set of 9 simple business vector icons. contains such as rights issue, royal mint, savings account, second-lien loan, variable rate mortgage, security, self-certification mortgage icons and others.
-
 Vector infographic in the form of a luminous variable graph. EPS 10
-
 Machine icons set with analysis design, computer cooler, gear algorithm and other variable architecture elements. Isolated vector illustration machine icons.
-
 Collage Database connection icon composed of square elements in variable sizes and color hues. Vector square elements are grouped into abstract composition database connection icon.
-
 API manager icon isometric vector. Data technology
-
 Collage Cloud computing icon united from square items in variable sizes and color hues. Vector square items are organized into abstract collage cloud computing icon. Bonus icons are placed.
-
 Data comparison in a split testing vector illustration
-
 Mosaic Category folder tree icon composed of square items in variable sizes and color hues. Vector square items are organized into abstract mosaic category folder tree icon.
-
 Standard deviation as statistics mathematical calculation outline diagram. Labeled educational scheme with sample mean, observed value and formula explanation vector illustration. Math data analysis.
-
 Forex statistics, financial analytics dashboard graph, line and arrows vector illustration
-
 Gauss distribution. Standard normal distribution. Bell curve symbol. Math probability theory. Vector illustration isolated on white background.
-
 Male hand pressing API key button
-
 Mathematical seamless pattern
-
 Modern rainbow timeline with circle milestones and set of icons
-
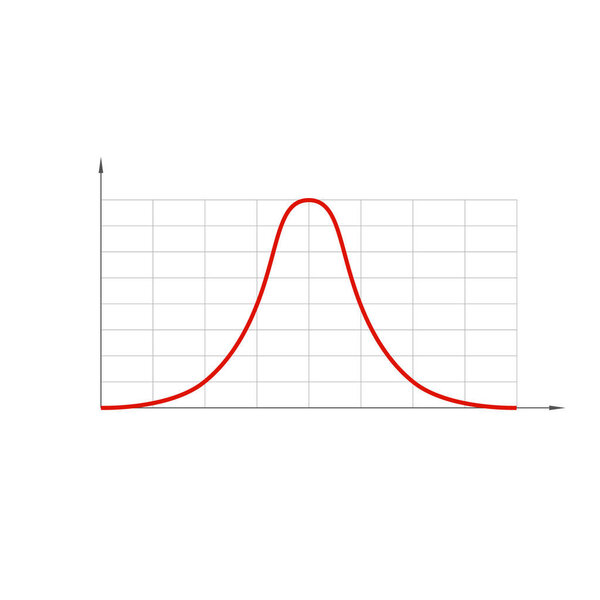 Standard normal distribution, also Gaussian distribution or bell curve.
-
 Devices and smart things
-
 Gaussian distribution. Standard normal distribution, sometimes informally called a bell curve, used in probability theory and statistics. Standard deviation. Illustration on white background. Vector.
-
 Api people diagram sign concept illustration
-
 Vector icon of personal computer with dollar php inscription on
-
 Api community sign concept illustration design
-
 Api technology updates sign concept
-
 API Application Programming Interface
-
 Scatter plot shows a weak degree of positive correlation
-
 Illustration of blue shield with programming technology ajax asynchronous JavaScript, isolated web site development icon
-
 Fixed-rate mortgage icon. Trendy flat vector Fixed-rate mortgage icon on white background from Business collection, vector illustration can be use for web and mobile, eps10
-
 CMS Content Management System word cloud, vector business concept background. Cloud storage icon.
-
 Degree of correlation. Scatter plot
-
 NTP - Network Time Protocol
-
 Vector collection of php web development shield signs: php eleph
-
 Science experiment poster concept with Liquid pressure illustration
-
 Rest api concept with modern big text or word and people with icon related modern flat style
-
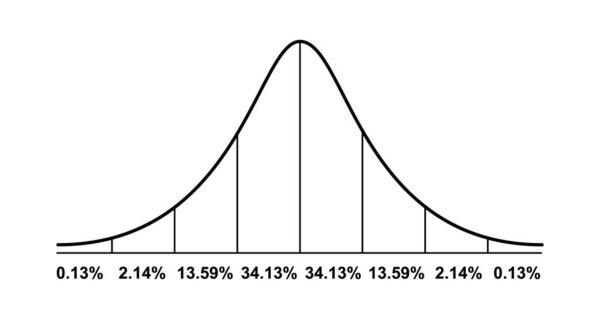 Gauss distribution. Standard normal distribution. Math probability theory. Distribution standard gaussian chart. Vector illustration isolated on white background.
-
 Object oriented programming or OOP paradigm explanation outline diagram
-
 Flat design with numbers and pink heart. I love math
-
 Colorful message icon
-
 Infographic Elements.
-
 Modern rainbow timeline with circle milestones with pastel fill. Set of icons included
-
 Alphabet letter in word parameter on crossword puzzle background
-
 Insoluble liquid with three layers in a glass illustration
-
 Programming, coding line icons, signs set. Collection of programming, coding, software, development, language, algorithm, logic, syntax, function outline vector illustrations.
-
 Programming, coding line icons signs set. Design collection of programming, coding, software, development, language, algorithm, logic, syntax outline vector concept illustrations
-
 Vote members statistics levels icon sign vector
-
 NTP - Network Time Protocol acronym
-
 Soluble and insoluble science experiment illustration
-
 Two scientists, a woman and a man, are studying complex mathematical formulas written on a blackboard, engaging in scientific discussion and analysis
-
 Label banner that have yellow headline with word hypothesis and white copy space, on gray background
-
 Futuristic hud banner that have word hypothesis on user interface screen on blue background
-
 Representational State Transfer REST API - Application program interface words. large text illustration
-
 Scatter plot shows a perfect degree of positive correlation
-
 Variability vector icon Linear icon. Editable stroked line
-
 Vector Smart Component Mosaic of Dots
-
 Fixed-rate mortgage icon. Trendy flat vector Fixed-rate mortgage icon on transparent background from Business collection. High quality filled Fixed-rate mortgage symbol use for web and mobile
-
 Line graph vector icon
-
 Vector website design template . CPQ - configure price quote, business concept. illustration for website banner, marketing materials, business presentation, online advertising.
-
 Vector Trend Chart Mosaic Icon of Triangle Items
-
 Vector Chart Collage of Dots
-
 Vector People Trend Chart Mosaic Icon of Triangle Items
-
 Vector Rocket Bar Chart Mosaic Icon of Triangles
-
 Developer Software Code Vector Icon
-
 User ascending icon in outline style. Icon for user management.
Each vector opens in a new tab with its details. Premium files are sold by Depositphotos; we may earn a commission if you buy. How this works.
