Variable data diagram vectors
93 variable data diagram vector illustrations picked from 7.3M royalty-free files, with no more than 3 per artist so you see real variety. Every file is a scalable EPS that opens in Illustrator, CorelDRAW, Affinity Designer and Inkscape, and exports to SVG or PNG at any size.
-
 Set of scatter plot diagrams. Scattergrams with different types of variables negative correlation. Data points plotted on a horizontal and a vertical axis on Cartesian plane. Vector flat illustration
-
 Set of scatter plot diagrams. Scattergrams with different types of variables correlation. Data points plotted on a horizontal and a vertical axis on Cartesian plane. Vector flat illustration
-
 Scatter plot correlation diagram line icon representing statistical data distribution analysis research variables mathematical function metric coordinates business reporting chart
-
 Regression analysis with linear data statistics results outline diagram. Labeled educational scheme and mathematical function calculation with variable outcome forecasting vector illustration.
-
 Data analytics icons including mining, machine learning, decision making, database, business intelligent, science, bar, line graph, scatter plot, histogram, pie chart, box, pyramid, average, variability, random sampling, frequency table, cluster
-
 Data analytics icons including scatter plot, scramble system, secure backup, shared web hosting, software developer, statistics, structure, update, timeline chart, unstructured, user analysis, variability.
-
 Vector statistical icons of correlation types. Positive, negative, no correlation. The relationship between two data sets or two random variables. Graphs or charts.
-
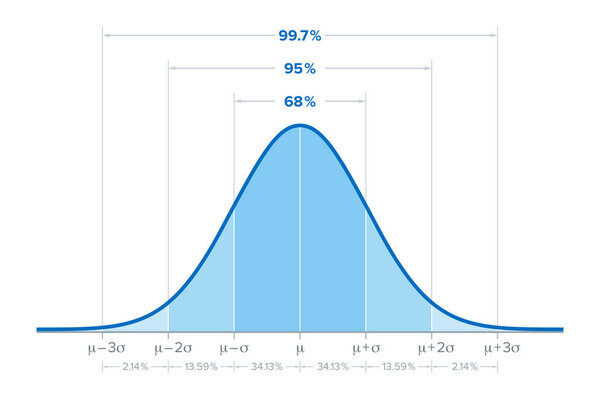 The standard deviation, sometimes called bell curve, describes the amount of variation in a data set by measuring and averaging, how much each value in the data set varies from the calculated mean.
-
 Correlation is a statistical measure that expresses the extent to which two variables are linearly related
-
 Gaus chart with different height columns. Normal distribution graph. Bell shaped curve template for statistics or logistic data. Probability theory math function. Vector flat illustration
-
 Object oriented programming or OOP paradigm explanation outline diagram
-
 India infographic with 3D bar and pie chart, increasing values, India country flag on 3D bar graph, ups and downs data, presentation graphic idea, developing country
-
 Mexico 3D bar chart graph with ups and downs, increasing values, Mexico country flag on 3D bar graph, upward rising arrow on data, news banner idea, developing country concept
-
 Api people diagram sign concept illustration
-
 Standard normal distribution, also Gaussian distribution or bell curve. Used in statistics and in natural and social sciences to represent real-valued random variables of unknown distributions. Vector
-
 Hypothesis testing and scientific experiment research outline diagram. Labeled educational scheme with alternative accepted and null not rejected hypothesis vector illustration. Opinion proof method.
-
 Bell curve symbol, a simplified diagram for a standard normal distribution, also called Gaussian distribution, used in probability theory and in statistics. Illustration on white background. Vector.
-
 Bars and line ascending of data analytics outline icon in white and black colors. bars and line ascending of data analytics flat vector icon from user interface collection for web, mobile apps ui.
-
 Cambodia infographic with 3D bar and pie chart, increasing values, Cambodia country flag on 3D bar graph, ups and downs data, presentation graphic idea, developing country
-
 Agricultural technology services infographic design template. Innovations in farming industry. Food production solutions. Data visualization 5 options. Process vertical flow chart
-
 Agricultural technology services rectangle infographic vector. Innovations in farming industry. Food production solutions. Data visualization with 5 steps. Editable rectangular options chart
-
 Infographic template design with user interface icons. timeline concept with 7 options or steps. included bars and line ascending of data analytics, data coding, emot, vertical data bars, multiple
-
 User interface infographic design template with pie chart circular interface, data coding, data analytics circular, data analytics dual bars, vertical bars, multiple variable points line chart,
-
 User interface infographic design template with simple chart interface, multiple variable point line, data analytics, data connected circular interface, data analytics cylinder, box plot chart
-
 Causal research benefits infographic template. Business studying. Data visualization with 4 steps. Editable timeline info chart. Workflow layout with line icons. Myriad Pro-Regular font used
-
 Vector infographic in the form of a luminous variable graph. EPS 10
-
 Bars and line ascending of data analytics outline vector icon. Thin line black bars and line ascending of data analytics icon, flat vector simple element illustration from editable user interface
-
 Machine icons set with analysis design, computer cooler, gear algorithm and other variable architecture elements. Isolated vector illustration machine icons.
-
 Data indicators metrics. Statistics variable, measurable information of outcomes vector monocolor illustration
-
 Diagram Vector Mesh Carcass Model and Triangle Mosaic Icon
-
 Mosaic Sales chart icon organized from square items in variable sizes and color hues. Vector square items are grouped into abstract composition sales chart icon. Bonus icons are placed.
-
 Demography Diagram Vector Mesh 2D Model and Triangle Mosaic Icon
-
 Bell curve graph, density curve graph. Gauss chart, normal distribution graph. template for statistics or logistic data. Probability theory math function. Vector flat illustration
-
 Chart and graph set featuring data statistics analysis visualization diagram report dashboard business analytics metrics distribution histogram scatter column
-
 Modern Outline Line Stroke Scatter Plot Bubble Chart Data Display Icon
-
 Minimalist Outline Scatter Plot Graph with Regression Curve Line and Data Points Icon Symbol
-
 Two code blocks connected by a line, representing programming or data structure.
-
 Scatter Plot Line Icon, Outline Symbol for Data Distribution, Statistical Correlation, Variable Research, Scientific Analysis, and Pattern Visualization. Vector Sign Icon.
-
 3D Isometric Flat Vector Illustration of ERG Theory, Pyramid Diagram, Visual Representation Of Motivation
-
 Line Art Scatter Plot Diagram with Axis and Data Points Icon
-
 Colorful box plot chart visualizing data distribution, highlighting quartiles, median, and potential outliers, offering insights into statistical trends across categories sf, hg, and bn
-
 A black electrical symbol for a variable capacitor with an arrow on a white background.
-
 Longitudinal study is a research design that involves repeated observations of the same variables over short or long periods of time
-
 A bar chart is a graphical representation of data where rectangular bars are used to compare different categories, showing values with varying lengths to highlight differences and trends.
-
 Correlation statistics graph. Positive and negative geometric diagram with mathematical variable and information scatter functions with vector calculations
-
 Graph showing fluctuating data trends over specific time period
-
 Calculus diagram of area between curves, showing a red parabola, blue line y x magenta shaded region, and x - y axes on white background vector.
-
 Calculus definite integral diagram showing red shaded area under blue function curve f x between limits a and b, isolated on white background.
-
 A stylized illustration of a bell curve graph with vertical bars representing data distribution.
-
 Mechanical and thermal CAD drawing of subsea variable speed drive VSD pressure vessel featuring natural convection seawater cooling fins and IGBT module
-
 Radar diagram icon for competitive analysis. Hand drawn doodle illustration of spider chart for multivariate data visualization and business metrics. Strategic tool for performance comparison, skill mapping and identifying corporate strengths.
-
 Technical aerospace spacecraft engineering CAD blueprint vector drawing of a variable specific impulse magnetoplasma rocket VASIMR showing helicon plasma ionization, ICRH booster, and magnetic nozzle expansion.
-
 Ideal gas law equation with labeled variables pressure volume amount temperature ideal gas constant for educational material use
-
 Variable Costs business finance accounting vector illustration graphic
-
 Infographic Elements.
-
 Gauss distribution. Standard normal distribution. Bell curve symbol. Math probability theory. Vector illustration isolated on white background.
-
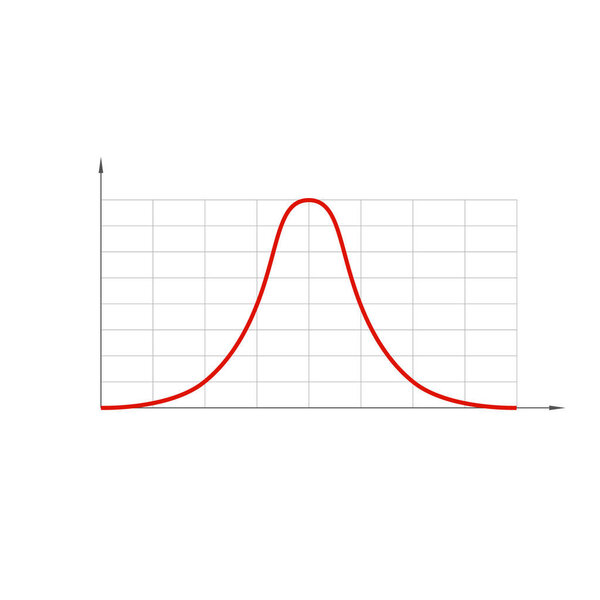 Standard normal distribution, also Gaussian distribution or bell curve.
-
 Degree of correlation. Scatter plot
-
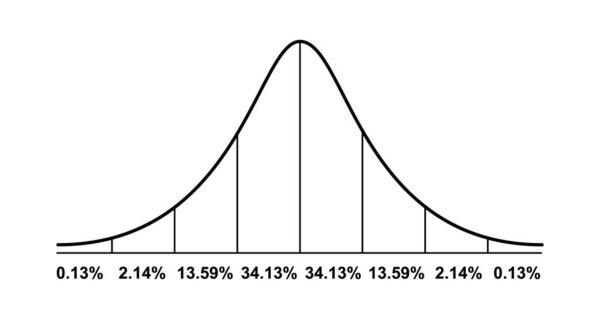 Gauss distribution. Standard normal distribution. Math probability theory. Distribution standard gaussian chart. Vector illustration isolated on white background.
-
 Scatter plot shows a weak degree of positive correlation
-
 Scatter plot shows a perfect degree of positive correlation
-
 Descriptive statistics compare with inferential statistics of sample and population
-
 Mixed total costs business accounting and finance vector illustration graphic
-
 Vector Trend Chart Mosaic Icon of Triangle Items
-
 User interface concept 14 colorful outline icons. 2 color blue s
-
 Line graph vector icon
-
 Web banner design with user interface concept elements.
-
 User interface concept infographic design template. included dat
-
 Vector website design template . CPQ - configure price quote, business concept. illustration for website banner, marketing materials, business presentation, online advertising.
-
 Vector Pie Chart Mosaic Icon of Triangle Items
-
 Vector Chart Collage of Dots
-
 Vector Dollar Trends Mosaic Icon of Triangles
-
 Vector Stock Chart Composition of Small Circles with Scratched Markets Stamp
-
 Kurva icon illustration logo design
-
 Scatter plot icon. Thin, Light Regular And Bold style design isolated on white background
-
 Statistics circle icon sign vector
-
 Mathematics icons in line design. mathematics, math, calculation, formula, equation, geometry, algebra on white background vector. Mathematics editable stroke icons.
-
 Break Even Point definition emblem banner vector illustration isolated. Business economy education. The point were total revenue equals total expenses, resulting in no profit or loss.
-
 Businessman drawing graphs supply vs demand curves concept, relationship between the quantity of a commodity that producers wish to sell at various prices, vector illustration
-
 Types of correlation. Strong, weak, and perfect positive correlation, strong, weak, and perfect negative correlation, no correlation. Scatter plot.
-
 Total costs business finance accounting educational vector illustration graphic
-
 Electric Circuit Voltmeter flat vector icon. Simple solid symbol isolated on white background
-
 Symbolic minimalist illustration. Thermometer icon with up and down arrows, suggesting temperature fluctuations. Useful for weather, healthcare, or datadriven design projects.
-
 This pack includes 12 clean vector icons in Line style, built around the Object theme.
-
 Linear function. Through the origin. Isolated on white. Blue icon set.
-
 High-performance collection of 42 SolidFill vector icons for Module, engineered with 128x128 PIXEL perfect resolution for optimal user interface design.
-
 A graphic representation of a piecewise linear function with saturation on an orange circular background.
-
 State-of-the-art bundle featuring 24 PIXEL perfect vector icons inspired by Experiment, created in Strong Outline format at 128x128 for next-generation interfaces.
-
 Curated pack of 24 128x128 vector icons in Filled design, centered around Shape concepts with PIXEL perfect clarity.
-
 A simple line graph with three fluctuating lines on a white background.
-
 Hand Drawn Bell Curve Icon Set. Sketch collection representing probability distribution theory and statistical analysis concepts for mathematical research visualization.
-
 Solar panel beneath cloud with rain upward arrow. Ideal for energy, sustainability, weather variability, clean technology, climate resilience, innovation, green energy. Line metaphor
-
 Mathematical function graphs and coordinate systems displayed on a clean web banner. Education, algebra, geometry, calculus, science, research. Plotting curves and axes on a Cartesian plane
Each vector opens in a new tab with its details. Premium files are sold by Depositphotos; we may earn a commission if you buy. How this works.

