Variable data business vectors
88 variable data business vector illustrations picked from 6.9M royalty-free files, with no more than 3 per artist so you see real variety. Every file is a scalable EPS that opens in Illustrator, CorelDRAW, Affinity Designer and Inkscape, and exports to SVG or PNG at any size.
-
 Vector statistical icons of correlation types. Positive, negative, no correlation. The relationship between two data sets or two random variables. Graphs or charts.
-
 Data analytics icons including mining, machine learning, decision making, database, business intelligent, science, bar, line graph, scatter plot, histogram, pie chart, box, pyramid, average, variability, random sampling, frequency table, cluster
-
 Data analytics icons including scatter plot, scramble system, secure backup, shared web hosting, software developer, statistics, structure, update, timeline chart, unstructured, user analysis, variability.
-
 Security Assessment System for Big Data Servers
-
 Control variables blue gradient concept icon. Business tests. Causal research changeable and principles abstract idea thin line illustration. Isolated outline drawing. Myriad Pro-Bold font used
-
 Dependent variables blue gradient concept icon. Causal research changeable and principles abstract idea thin line illustration. Isolated outline drawing. Myriad Pro-Bold font used
-
 Independent variables blue gradient concept icon. Causal research changeable and principles abstract idea thin line illustration. Isolated outline drawing. Myriad Pro-Bold font used
-
 API Application Programming Interface with Laptop, Pencil, Cloud Data
-
 India infographic with 3D bar and pie chart, increasing values, India country flag on 3D bar graph, ups and downs data, presentation graphic idea, developing country
-
 Mexico 3D bar chart graph with ups and downs, increasing values, Mexico country flag on 3D bar graph, upward rising arrow on data, news banner idea, developing country concept
-
 Longitudinal study compare to Cross-sectional study for observe subject data with different period of time
-
 Independent variable with control variable to see dependent variable of the experiment
-
 Set of 40 filled user interface web icons in glyph style such as data analytics cylinder, box plot chart interface, data analytics lines on spherical grid, data analysis pie chart interface, simple
-
 User interface concept business infographic design with 10 hexag
-
 Infographic template design with user interface icons. timeline concept with 7 options or steps. included brainstorming, reload pie chart, multiple variable bars data, writing square, binary data
-
 Fixed-rate mortgage icon. Trendy flat vector Fixed-rate mortgage icon on white background from Business collection, vector illustration can be use for web and mobile, eps10
-
 Longitudinal study is a research design that involves repeated observations of the same variables over short or long periods of time
-
 NTP Network Time Protocol - networking protocol for clock synchronization between computer systems over packet-switched, variable-latency data networks, acronym text concept background
-
 Bars and line ascending of data analytics outline icon in white and black colors. bars and line ascending of data analytics flat vector icon from user interface collection for web, mobile apps ui.
-
 Standard normal distribution, also Gaussian distribution or bell curve. Used in statistics and in natural and social sciences to represent real-valued random variables of unknown distributions. Vector
-
 Cambodia infographic with 3D bar and pie chart, increasing values, Cambodia country flag on 3D bar graph, ups and downs data, presentation graphic idea, developing country
-
 Set of 24 outline web market research icons such as cost, focus group, interview, eye tracking, public opinion, independent variable, targeting vector icons for report, presentation, diagram, web
-
 Infographic template design with user interface icons. timeline concept with 7 options or steps. included bars and line ascending of data analytics, data coding, emot, vertical data bars, multiple
-
 Set of 16 vector stroke icons such as bars chart page, data conn
-
 Data indicators metrics. Statistics variable, measurable information of outcomes vector monocolor illustration
-
 Set of 9 simple business vector icons. contains such as rights issue, royal mint, savings account, second-lien loan, variable rate mortgage, security, self-certification mortgage icons and others.
-
 API manager icon isometric vector. Data technology
-
 Bars and line ascending of data analytics outline vector icon. Thin line black bars and line ascending of data analytics icon, flat vector simple element illustration from editable user interface
-
 Vector infographic in the form of a luminous variable graph. EPS 10
-
 Vector website design template . CPQ - configure price quote, business concept. illustration for website banner, marketing materials, business presentation, online advertising.
-
 Infographic template design with user interface icons. timeline concept with 7 options or steps. included multiple variable point line, dual bars interface, cart interface, triangular pyramid,
-
 NTP - Network Time Protocol, acronym business concept
-
 Fixed-rate mortgage icon. Trendy flat vector Fixed-rate mortgage icon on transparent background from Business collection. High quality filled Fixed-rate mortgage symbol use for web and mobile
-
 Infographic template with icons and 7 options or steps. infographic for user interface collection. concept. included hidden, user data analytics, cube of squares, multiple variable lines, dual
-
 Inserted green color label sticker with word variable cost on gray background
-
 Rocket Business Start Vector Mesh Network Model and Triangle Mosaic Icon
-
 Euro Business Bar Chart Vector Mesh 2D Model and Triangle Mosaic Icon
-
 Data cloud icon outline vector. Computer upload
-
 Black and gold color round sticker with word variable cost on white background
-
 Grunge black variable cost word hexagon rubber seal stamp on white background
-
 Hatch mosaic Euro cloud banking icon organized from straight elements in variable sizes and color hues. Vector hatch elements are combined into abstract collage Euro cloud banking icon.
-
 Infographic template with icons and 8 options or steps. infographic for user interface concept. included multiple variable lines, data analytics bars, table for data, user data analytics, email
-
 Infographic template with icons and 7 options or steps. infographic for user interface concept. included bars chart page, slide right, multiple variable lines, radio button, confirmity, data import
-
 Bell curve graph, density curve graph. Gauss chart, normal distribution graph. template for statistics or logistic data. Probability theory math function. Vector flat illustration
-
 Chart and graph set featuring data statistics analysis visualization diagram report dashboard business analytics metrics distribution histogram scatter column
-
 Modern Outline Line Stroke Scatter Plot Bubble Chart Data Display Icon
-
 Minimalist Outline Scatter Plot Graph with Regression Curve Line and Data Points Icon Symbol
-
 Break Even Point definition emblem banner vector illustration isolated. Business economy education. The point were total revenue equals total expenses, resulting in no profit or loss.
-
 Financial resource icon. Money company source icons. Icon symbol compatible for finance, financial, business, management, logistic, asset, material, process, asset. Vector illustration.
-
 Power resource icon. Electricity company source icons. Icon symbol compatible for finance, financial, business, management, logistic, asset, material, process, asset. Vector illustration.
-
 Fuel resource icon. Money company source icons. Icon symbol compatible for finance, financial, business, management, logistic, asset, material, process, asset. Vector illustration.
-
 Variable percentage. Vector linear icon isolated on white background.
-
 Market research outline icon set such as thin line de, survey, engagement, questionnaire, data, independent variable, testing icons for report, presentation, diagram, web design
-
 Data analysis black line icon for digital and print projects. Minimal clean icons for apps and websites. Modern simple icons for UI UX and branding
-
 Line Art Scatter Plot Diagram with Axis and Data Points Icon
-
 Colorful box plot chart visualizing data distribution, highlighting quartiles, median, and potential outliers, offering insights into statistical trends across categories sf, hg, and bn
-
 Set of 10 outline web market research icons such as eye tracking, population, board, data collection, engagement, qualification, market vector icons for report, presentation, diagram, web design,
-
 Total costs business finance accounting educational vector illustration graphic
-
 Market research outline icon set includes thin line dependant, engagement, market research, user, independent variable, consumer, agile icons for report, presentation, diagram, web design
-
 Modern rainbow timeline with circle milestones with pastel fill. Set of icons included
-
 Forex statistics, financial analytics dashboard graph, line and arrows vector illustration
-
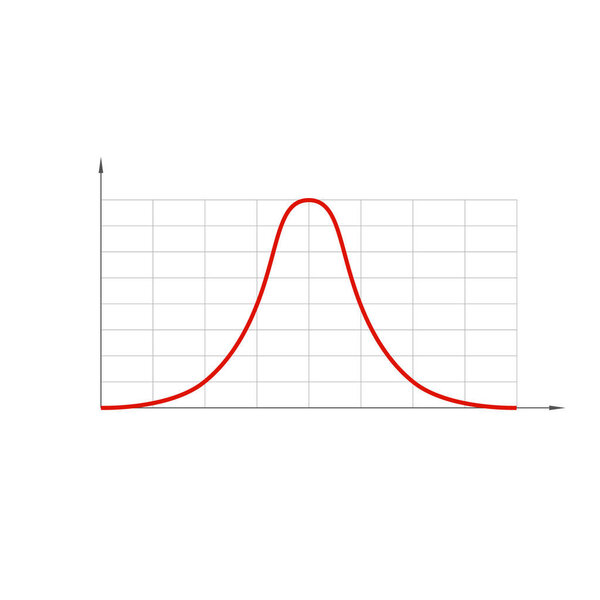 Standard normal distribution, also Gaussian distribution or bell curve.
-
 Gauss distribution. Standard normal distribution. Bell curve symbol. Math probability theory. Vector illustration isolated on white background.
-
 Modern rainbow timeline with circle milestones and set of icons
-
 Scatter plot shows a weak degree of positive correlation
-
 Illustration of violet shield with php programming language question mark, isolated web site development icon
-
 NTP - Network Time Protocol
-
 Vector icon of personal computer with dollar php inscription on
-
 Gaussian distribution. Standard normal distribution, sometimes informally called a bell curve, used in probability theory and statistics. Standard deviation. Illustration on white background. Vector.
-
 Degree of correlation. Scatter plot
-
 Illustration of blue shield with programming technology ajax asynchronous JavaScript, isolated web site development icon
-
 API Application Programming Interface
-
 Colorful message icon
-
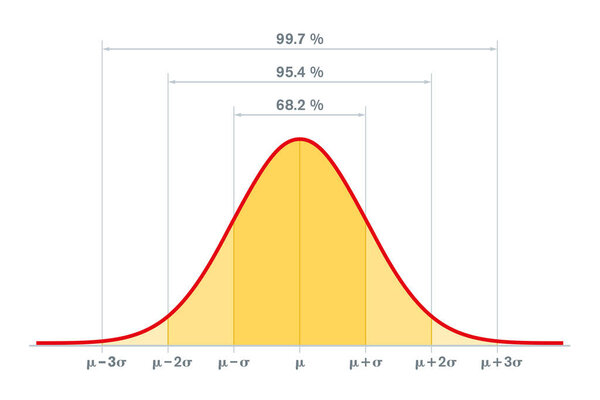 Standard normal distribution, standard deviation and coverage in statistics. Empirical rule, 3-sigma or 689599.7 rule. Gaussian distribution or bell curve, used in statistics. Illustration. Vector.
-
 Representational State Transfer REST API - Application program interface words. large text illustration
-
 Scatter plot shows a perfect degree of positive correlation
-
 User interface concept 14 colorful outline icons. 2 color blue s
-
 Variability vector icon Linear icon. Editable stroked line
-
 Line graph vector icon
-
 Vector Dollar Trends Mosaic Icon of Triangles
-
 Vector Financial Trends Mosaic Icon of Triangles
-
 Kurva icon illustration logo design
-
 Scatter plot icon. Thin, Light Regular And Bold style design isolated on white background
-
 Carefully curated 24 Bold Line vector icons for Price, featuring 128x128 PIXEL perfect resolution for consistent brand representation and user experience.
-
 Businessman drawing graphs supply vs demand curves concept, relationship between the quantity of a commodity that producers wish to sell at various prices, vector illustration
-
 Fx symbol in gradient color on white background.
-
 Thermistor icon on white background. NTCThermistor Resistor sign. flat style.
-
 3D Isometric Flat Vector Illustration of ERG Theory, Pyramid Diagram, Visual Representation Of Motivation
Each vector opens in a new tab with its details. Premium files are sold by Depositphotos; we may earn a commission if you buy. How this works.


