Variable data statistics vectors
82 variable data statistics vector illustrations picked from 383 royalty-free files, with no more than 3 per artist so you see real variety. Every file is a scalable EPS that opens in Illustrator, CorelDRAW, Affinity Designer and Inkscape, and exports to SVG or PNG at any size.
-
 Data indicators metrics. Statistics variable, measurable information of outcomes vector monocolor illustration
-
 Regression analysis with linear data statistics results outline diagram. Labeled educational scheme and mathematical function calculation with variable outcome forecasting vector illustration.
-
 Line graph tracking points over time and bar chart comparing variables. Ideal for data analysis, business growth, financial planning, market trends, statistics, presentations, simple flat metaphor
-
 Bar chart with variable data columns next to an online dashboard interface. Ideal for analytics, statistics, reporting, performance tracking, business, marketing, research, simple flat metaphor
-
 Data analytics icons including mining, machine learning, decision making, database, business intelligent, science, bar, line graph, scatter plot, histogram, pie chart, box, pyramid, average, variability, random sampling, frequency table, cluster
-
 Data analytics icons including scatter plot, scramble system, secure backup, shared web hosting, software developer, statistics, structure, update, timeline chart, unstructured, user analysis, variability.
-
 Forex statistics, financial analytics dashboard graph, line and arrows vector illustration
-
 Vector statistical icons of correlation types. Positive, negative, no correlation. The relationship between two data sets or two random variables. Graphs or charts.
-
 Gaus chart with different height columns. Normal distribution graph. Bell shaped curve template for statistics or logistic data. Probability theory math function. Vector flat illustration
-
 Gaussian distribution. Standard normal distribution, sometimes informally called a bell curve, used in probability theory and statistics. Standard deviation. Illustration on white background. Vector.
-
 Standard normal distribution, with the percentages for three standard deviations of the mean. Sometimes informally called bell curve. Used in probability theory and in statistics. Illustration. Vector
-
 Vote members statistics levels icon sign vector
-
 Standard normal distribution, also Gaussian distribution or bell curve. Used in statistics and in natural and social sciences to represent real-valued random variables of unknown distributions. Vector
-
 Gaussian or normal distribution graphs examples. Bell curve templates. Probability theory concept. Layout for statistics or logistic data isolated on white background. Vector illustration
-
 Correlation is a statistical measure that expresses the extent to which two variables are linearly related
-
 Set of scatter plot diagrams. Scattergrams with different types of variables negative correlation. Data points plotted on a horizontal and a vertical axis on Cartesian plane. Vector flat illustration
-
 India infographic with 3D bar and pie chart, increasing values, India country flag on 3D bar graph, ups and downs data, presentation graphic idea, developing country
-
 Descriptive statistics compare with inferential statistics of sample and population
-
 Cambodia infographic with 3D bar and pie chart, increasing values, Cambodia country flag on 3D bar graph, ups and downs data, presentation graphic idea, developing country
-
 Statistics Composition Icon of Circles
-
 Standard deviation as statistics mathematical calculation outline diagram. Labeled educational scheme with sample mean, observed value and formula explanation vector illustration. Math data analysis.
-
 Vector Statistics Charts Mosaic Icon of Triangle Items
-
 Vector Statistics Charts Mosaic Icon of Triangle Elements
-
 Line mosaic sales chart icon united from thin items in variable sizes and color hues. Vector line elements are united into abstract collage sales chart icon. Bonus icons are placed.
-
 Statistics Mosaic Icon of Spheric Items
-
 Bell curve graph, density curve graph. Gauss chart, normal distribution graph. template for statistics or logistic data. Probability theory math function. Vector flat illustration
-
 Analytics of data mining process linear pixel perfect icon. Development graph. Thin line customizable illustration. Contour symbol. Vector isolated outline drawing. Editable stroke. Arial font used
-
 Denmark infographic with 3D bar and pie chart, increasing values, Denmark country flag on 3D bar graph, ups and downs data, presentation graphic idea, developing country
-
 Statistics circle icon sign vector
-
 Chart and graph set featuring data statistics analysis visualization diagram report dashboard business analytics metrics distribution histogram scatter column
-
 Scatter plot distribution graph icon with colorful variable points and dots for statistical correlation analysis and research scientific data evaluation
-
 Scatter plot correlation diagram line icon representing statistical data distribution analysis research variables mathematical function metric coordinates business reporting chart
-
 Scatter Plot Line Icon, Outline Symbol for Data Distribution, Statistical Correlation, Variable Research, Scientific Analysis, and Pattern Visualization. Vector Sign Icon.
-
 Analytics of data mining process black glyph icon. Development graph. Virtual information statistics. Collect and analyze digital data. Silhouette symbol on white space. Vector isolated illustration
-
 Data mining statistics gradient linear vector icon. Information analytic process. Virtual tool of dataset marking. Thin line color symbol. Modern style pictogram. Vector isolated outline drawing
-
 Outline L Shape Axis with Scattered Data Points Icon
-
 Colorful box plot chart visualizing data distribution, highlighting quartiles, median, and potential outliers, offering insights into statistical trends across categories sf, hg, and bn
-
 Correlation statistics graph. Positive and negative geometric diagram with mathematical variable and information scatter functions with vector calculations
-
 A bar chart is a graphical representation of data where rectangular bars are used to compare different categories, showing values with varying lengths to highlight differences and trends.
-
 Pie chart showcasing data distribution paired with a bell curve for demographic and percentage insights. Ideal for analytics, statistics, business reports, marketing trends, research, data science
-
 A line graph is a visual representation of data that shows how values change over time or another variable. Vector set of icons in line, black and colorful styles isolated.
-
 Graph showing fluctuating data trends over specific time period
-
 Financial line element with zigzag path demonstrating instability and variable market behavior.
-
 A stylized illustration of a bell curve graph with vertical bars representing data distribution.
-
 Statistics point click icon sign vector
-
 Correlation analysis or bivariate statistics calculation outline hands concept. Mathematical market research technique and method finding out whether a relationship exists between variables.
-
 Radar diagram icon for competitive analysis. Hand drawn doodle illustration of spider chart for multivariate data visualization and business metrics. Strategic tool for performance comparison, skill mapping and identifying corporate strengths.
-
 Outline Scatter Plot Chart Data Visualization Icon Symbol
-
 Infographic flow chart and data stream process template. Colorful financial analytics and statistical workflow layout for corporate presentations and business reports.
-
 Orange color led banner in word variable on black background
-
 Data analytics icons including cloud computing, information presentation, timeline chart, complexity, automation, scalability, protocols, growing, protection, missing pattern, shared web hosting, internet server error.
-
 Bar chart icon. Abstract data visualization. Line graph elements. Simple analytic symbol. EPS 10.
-
 Minimalist Outline Scatter Plot Graph Data Analytics Coordinate Chart Icon Sign
-
 Area plot with data points
-
 Vector icon of polynomial regression with a curved trend line through data points. Dark brown charcoal sketch on transparent background. Hand-drawn concept for non-linear AI modeling
-
 Gauss distribution. Standard normal distribution. Bell curve symbol. Math probability theory. Vector illustration isolated on white background.
-
 Infographic Elements.
-
 Scatter plot shows a perfect degree of positive correlation
-
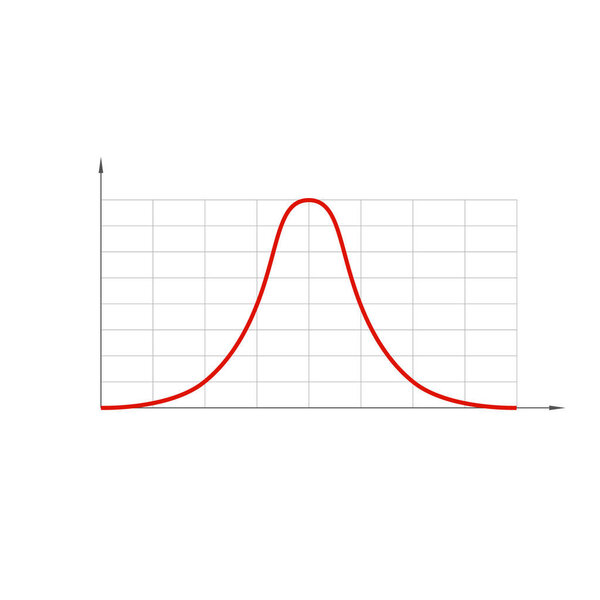 Standard normal distribution, also Gaussian distribution or bell curve.
-
 Degree of correlation. Scatter plot
-
 Scatter plot shows a weak degree of positive correlation
-
 Alphabet letter in word parameter on crossword puzzle background
-
 Profit loss chart. Zigzag arrow line. Vector business graph. Rising rebound concept. EPS 10.
-
 Vector Trend Chart Mosaic Icon of Triangle Items
-
 Vector Chart Collage of Dots
-
 Web banner design with user interface concept elements.
-
 Futuristic hud banner that have word parameter on user interface screen on blue background
-
 Kurva icon illustration logo design
-
 Scatter plot icon. Thin, Light Regular And Bold style design isolated on white background
-
 Mathematics icons in line design. mathematics, math, calculation, formula, equation, geometry, algebra on white background vector. Mathematics editable stroke icons.
-
 Businessman drawing graphs supply vs demand curves concept, relationship between the quantity of a commodity that producers wish to sell at various prices, vector illustration
-
 Horizontal bar graph icon sign vector
-
 Types of correlation. Strong, weak, and perfect positive correlation, strong, weak, and perfect negative correlation, no correlation. Scatter plot.
-
 Regression Analysis Model for Predictive Machine Learning
-
 Black Normal Distribution Glyph on white background
-
 Number generator icon sign vector
-
 Minimalist Icon of a Calculator Representing Education and Science Concepts in a Contemporary Digital Environment
-
 A simple line graph with three fluctuating lines on a white background.
-
 Hand Drawn Bell Curve Icon Set. Sketch collection representing probability distribution theory and statistical analysis concepts for mathematical research visualization.
-
 Bar chart icon in glyph style
-
 Calculate rate symbol with a calculator and pie chart. Easy to use for your website or presentation.
-
 Feature for AI icon. Simple outline monochrome black vector pictogram with thin lines on a transparent background. Line thickness is editable
Each vector opens in a new tab with its details. Premium files are sold by Depositphotos; we may earn a commission if you buy. How this works.
