Trend data vectors
100 trend data vector illustrations picked from 9.8M royalty-free files, with no more than 3 per artist so you see real variety. Every file is a scalable EPS that opens in Illustrator, CorelDRAW, Affinity Designer and Inkscape, and exports to SVG or PNG at any size.
-
 Stock market investment trading graph or forex graph global network line wire frame data business concept for financial investment economic trends vector illustration
-
 A digital representation of stock market performance with connected dots illustrating data points and trends
-
 Stock market investment trading illustration concept. Financial bar chart, yield curves, bond data, and upward-sloping graph on a white background. Business candlestick trend graph
-
 Financial Performance Analytics Dashboard Metrics KPI Revenue Growth CAC Reduction Trend Uptrend Chart Bars Data Visualization Reporting Strategy Green Gradient Vector Illustration.
-
 Data analysis, marketing research, statistics visualization graph and chart model, prediction benchmark or analytics diagram, insight and trend, business people look at data analysis graph and chart.
-
 Stock market modern flat concept for web banner design. Woman is engaged in trading, analyzes financial data with growth trend and bargain invests money. Vector illustration with isolated people scene
-
 Data Insights Icon: Uncover Patterns and Trends. Visual Analytic
-
 Arrow pointing right, bar graph with data points, magnifying glass, and upward arrow. Ideal for business growth, data analysis, market trends, financial progress, performance review strategy
-
 Line graph with data points and spikes paired with a dashboard featuring various charts and analytics. Ideal for reporting, business analysis, trend prediction, statistics, data visualization
-
 Big data analysis illustration
-
 Big data funnel
-
 Abstract growth graph chart with tech arrow up on computer monitor screen. Data analysis concept on technology background in digital futuristic light blue style. Low poly wireframe vector illustration
-
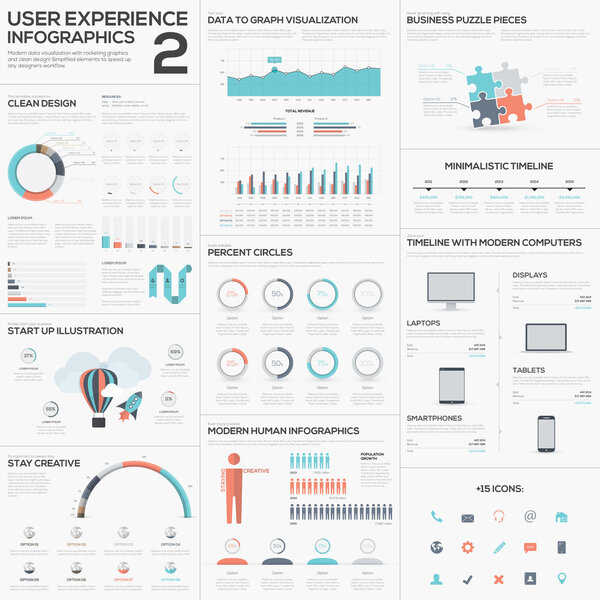 Data analytics vector infographics with clean trendy flat design
-
 Big Data Statistics Background
-
 Data analysis poster
-
 Black infographic vector template elements data visualization
-
 Big pack of data visualization vector infographics and design elements with business bar, charts, graph, diagrams and icon set for brochures, flyers and websites
-
 Financial stock market graph on stock market investment trading, Bullish point, Bearish point. trend of graph for business idea and all art work design. vector illustration
-
 Stock market investment trading graph concept background. Economic trends, forex and crypto graphic. Vector illustration. EPS 10.
-
 Forex stock chart. Data candle graph.
-
 Linear Trend Vector Mesh
-
 Clean financial visualization showcasing stock market data using candlestick and line graphs. Perfect for presentations and financial analytics. Concept of economics, financial analytics, business
-
 Glowing vector chart of investment financial data. Infographic elements and realistic transparent world map
-
 Financial graph and stock market up and down. business investment to success. trading data chart strategy. market profit money. vector illustration hi-tech.
-
 Set Flat 2D concepts financial analysis, data collection application, business planning, graphs and charts. For Concept for web design
-
 Dashboard info data charts, graphs and diagrams for infographics presentation, vector statistics bars. Finance report, business graphic charts and marketing diagrams with percent pies and flowchart
-
 AI finance and data-driven economy concept with glowing growth chart rising from a circuit board. Futuristic bars, analytics line, and neon cyber grid in blue vector illustration.
-
 Professional data visualization interface showing sales metrics, revenue growth, and regional distribution performance analytics.
-
 Black and white icon of a computer monitor displaying a rising line graph, symbolizing data analysis
-
 Business candlestick stock chart on dark background. stock investment trading. up trend concept.
-
 Data analysis concept, statistics for analysis, business graph dashboard, marketing research, diagrams for optimization, big information, businessman marketing team analyzing graphs and charts.
-
 Business investment trading stock growth on tablet. finance forex trade candlestick technology. Economy trends graph stock market statistics. vector illustration fantastic technology.
-
 Magnifying glass examining through a paper with trending graphs to picturise trend analysis
-
 Modern infographic dashboard template. Trendy futuristic ui interface with graphs, statistics, chart and diagrams. Vector admin panel data technology hud screen, presentation analytical report
-
 Infographic dashboard mockups with pie charts, information, diagrams and graphs. Presentation slides online statistics and data analytics. Template gradient UI, UX, info panels. Vector graphics set
-
 Analytics Infographic 10 line icons template.linear graph, web research, trend, monitoring simple icons
-
 Graphics infographic, template dashboard with info elements - charts, diagrams, data analytics, infographic and online statistics. Vector Mockup panel with UI, UX, KIT design elements. Vector graphic
-
 Isometric banner template for market analytics and mobile finance. Vector illustration of a smartphone with data charts for business research, stock trading, and investment strategy
-
 Bar financial data graph. Forex stock crypto currency trade pattern triangle.
-
 Stock market or forex trading graph in futuristic concept for financial investment or economic trends business idea. Financial trade concept. Stock market and exchange Candle stick graph chart vector.
-
 Horizontal banner stock market or forex trading platform. Dashboard with online trading, investment, market monitoring and analysis and real-time data. Banner stock exchange and binary option. Vector
-
 Financial yield curves, candlestick chart, bond data, and upward-sloping graph on a white background. Improved business information and finance growth data. Successful stock market wallpaper
-
 Data analysis icon with grey concept line dots graph symbol.
-
 Successful stock market wallpaper. Improved business information and financial growth data. Business growth background with the bar chart static and up arrow. Financial data strategy
-
 Up trend arrow, economic future, Business candle stick graph chart of stock market investment trading, economy and investing background design. Bullish point, Trend of graph. Vector illustration
-
 Word cloud - big data
-
 Infographic dashboard template with flat design graphs and pie charts Online statistics and data Analytics. Information Graphics elements for UI UX design. Modern style web elements.
-
 Analytics icon vector from big data collection. Thin line analytics outline icon vector illustration. Linear symbol for use on web and mobile apps, logo, print media
-
 Set of one hundred technology icons
-
 Chart line concept, flat tiny businessman persons vector illustration
-
 Analysis
-
 Businessman hand controlling chart graphic vector illustration. Flat style design
-
 Modern Design Minimal jigsaw style infographic
-
 Young woman holds a magnifying glass and analyzes economic statistic, diagram, infographics. Flat style vector illustration.
-
 Simple color financial management reports icon
-
 Green Business Charts and Graphics Set. Vector
-
 Business Analysis symbol with magnifying glass icon and pie chart.
-
 Internet of things flat icons set
-
 Abstract flat ui statistics templates
-
 Technical Analysis Of Exchange Trade, stock market or stock exchange vector illustration
-
 Investing background. Candlestick charts for stock exchange with dot world map in background. Stock market conceptual background.
-
 Infographics elements with icons. For business and finance reports, HR, statistics, diagram graph
-
 Stock and Graph design background. Business graph banner design eps10 vector. Illustration.
-
 Forex chart backdrop with candlestick and index grid.
-
 Word cloud - business analytics
-
 Arrow way infographic template 4 options.
-
 Crypto market candlestick chart on dark background. red-green candlesticks with upside arrow indicate. analysis, investment, trading, cryptocurrency, business finance
-
 World stock market index graph. Candlestick chart, line graph and bar chart. Glow light. Stock market growth illustration. Financial market background. Dark Blue color. Vector illustration
-
 Vector Infographic banner template Business Intelligence. Modern flat color design. Can be used for process diagram, presentations, workflow, banner with BUSINESS INTELLIGENCE icons
-
 Investing subtle background. Candle stick charts for stock exchange with dot world map in background. Stock market conceptual background.
-
 Diagram chart vector.
-
 Growth graph chart and up arrow. Abstract finger touching on chart bar. Histogram in technology light blue hologram style. Finance and stock market concepts. Low poly wireframe vector illustration.
-
 Design infographic template 5 options. Business concept
-
 Stock market or forex trading graph. Chart in financial market vector illustration Abstract finance background
-
 World stock market index graph. Candlestick chart, line graph and bar chart. Stock market growth illustration. Financial market background. Blue color. Vector illustration
-
 Vector background with stock market candlesticks chart. Forex trading creative design. Candlestick graph illustration for trade analytics
-
 An illustration stock quote a figure rising
-
 Stock market crypto Candlestick pattern in forex or stock market in green and red colors. Vector illustration
-
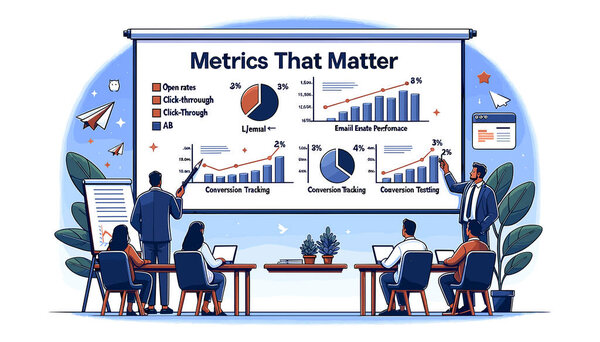 The slide is titled 'Metrics that Matter'. It displays business analysts reviewing charts and graphs related to email performance
-
 World stock market index graph. Candlestick chart, line graph and bar chart. Stock market growth illustration. Financial market background. Dark Blue color. Vector illustration
-
 Blue Light Negative Bar Graph Chart Depreciation Business Economic Recession
-
 Big set of infographic business elements blue green vector EPS10
-
 Futuristic financial graph visualization featuring illuminated bar and line charts
-
 Stock market trading graph. Candlestick graph. Vector illustration
-
 Business financial blue abstract background with uptrend candle stick pattern of stock market, investment growth success finance business chart
-
 Financial chart with uptrend line graphs and candlesticks. Abstract infographics visualization. Graphic concept for your design
-
 Technical analyze graphic with candlestick chart illustration. market volatility chart for stock trading, cryptocurrency background.
-
 Dark-mode marketing dashboard displaying social media metrics, engagement rates, and performance charts.
-
 Business Analytics Isometric Background
-
 Abstract background of stock market gold indicator candle graph
-
 3D Smartphone with graphs in isometric projection
-
 Elements of Infographics with buttons and menus
-
 Vector : Increasing arrow with stock board on blue background
-
 Isometric design concept mobile application analytics tools. Vector illustrations.
-
 Digital growth graph chart with up arrow on technology blue background. Business and financial concept. Stock market and investment symbol. Low poly wireframe vector illustration in futuristic style.
-
 Candle stick chart investing illustration. Bullish uptrend. Suitable for stock exchange, forex trading and crypto price analysis.
-
 Isometric infographic charts. Graph, circle diagram, pie chart and columns with timeline. Business statistic and analytic element vector set
-
 Color Graph Chart Icons Set on White Background. Vector
-
 Economy and stock market business and financial background concept. Vector illustration design.
-
 Candle stick graph chart of stock market investment trading, Stock exchange concept design and background. Vector illustrations.
Each vector opens in a new tab with its details. Premium files are sold by Depositphotos; we may earn a commission if you buy. How this works.
