Plot line science chart vectors
96 plot line science chart vector illustrations picked from 3.3M royalty-free files, with no more than 3 per artist so you see real variety. Every file is a scalable EPS that opens in Illustrator, CorelDRAW, Affinity Designer and Inkscape, and exports to SVG or PNG at any size.
-
 Data analytics icons including mining, machine learning, decision making, database, business intelligent, science, bar, line graph, scatter plot, histogram, pie chart, box, pyramid, average, variability, random sampling, frequency table, cluster
-
 Success business, Dot plot and 360 degree signs. Employees group, Hypoallergenic tested and Diagram chart line icons set. Gears, Capsule pill symbols. Collaboration, Feather. Science set. Vector
-
 Seo analysis, Support consultant and Money diagram line icons set. Time, Dot plot and Bacteria signs. Targeting chart, Question mark, Currency diagram. Clock. Science set. Vector
-
 Vector statistical icons of correlation types. Positive, negative, no correlation. The relationship between two data sets or two random variables. Graphs or charts.
-
 Mathematical function Vector Style Black thin line
-
 Coordinate grid template chart to analyze the chart
-
 Business development results infographic chart design template set. Visual data presentation. Editable bar graphs and circular diagrams collection. Myriad Variable Concept font used
-
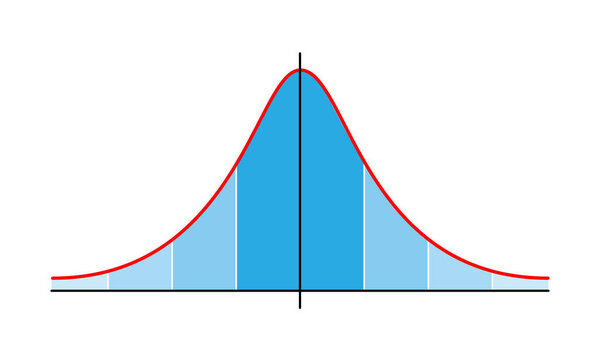 Gauss distribution. Standard normal distribution. Distribution standard gaussian chart. Bell curve symbol. Vector illustration isolated on white background.
-
 Gauss distribution. Distribution standard gaussian chart. Standard normal distribution. Bell curve symbol. Vector illustration. stock image. EPS 10.
-
 Set line Mathematics function cosine, Chalkboard and Mathematics function sine. Business infographic template. Vector
-
 Scientific discoveries demonstration infographic chart design template set for dark theme. Visual data presentation. Bar graphs and circular diagrams collection. Myriad Variable Concept font used
-
 Box and whisker plot diagram
-
 Scatter plot shows a perfect degree of positive correlation
-
 Economic finance graphics chart icon. Market sale diagram graph for presentation. Vector
-
 Graphics chart in modern flat design.
-
 Simple set of graph related, pie diagram, bar charts and graphs line icons. Can be widely used for representing data in many areas such as statistics, data science, math, economics, market. 48x48 Pixel perfect icon, editable stroke. Vector.
-
 Line Plot Eps Vector Icon
-
 Graph phone, Safe time and Infographic graph line icons set. World statistics, Article and 360 degrees signs. Swipe up, Dot plot symbols. Mobile statistics, Hold clock, Line diagram. Vector
-
 Hysteresis RGB color icon. Graph curve to represent magnetic field. Mathematical function. Educational chart. Growth and decline in physics grid. Rate of unemployment. Isolated vector illustration
-
 Diagram showing plot of potential energy vs reaction coordinate
-
 Line Mosaic Gauss Plot
-
 Degree of correlation. Scatter plot
-
 Cartesian coordinate system plane chart axis diagram white.
-
 Cartesian coordinate system icon. Thin linear cartesian coordinate system outline icon isolated on white background from education collection. Line vector sign, symbol for web and mobile
-
 Gaussian function vector icon in 6 different modern styles. Black, two colored gaussian function icons designed in filled, outline, line and stroke style. Vector illustration can be used for web,
-
 Raphic chart with heart icon
-
 Linear Function Plot Vector Mesh
-
 Sinusoid plot line vector doodle simple icon
-
 Set line XYZ Coordinate system, Function mathematical symbol and Mathematics function cosine. Business infographic template. Vector
-
 Set line Calculator, Mathematics function sine and Graph, schedule, chart, diagram. Business infographic template. Vector.
-
 Probability icon vector from risk management collection. Thin line probability outline icon vector illustration. Outline, thin line probability icon for website design and mobile, app development
-
 Cartesian coordinate system vector icon in 6 different modern styles. Black, two colored cartesian coordinate system icons designed in filled, outline, line and stroke style. Vector illustration can
-
 Grid, Graph, Drawing, area, software Line icon with 5 steps pres
-
 Charts line vector doodle simple icon set
-
 Smooth line chart icon in different style vector illustration. t
-
 Outline cartesian coordinate system vector icon. isolated black simple line element illustration from education concept. editable vector stroke cartesian coordinate system icon on white background
-
 Data visualization. Radial diagram, analytics. Big data complexity on white background. Polar chart presenting scientific data, use values and angles to display information such as polar coordinates
-
 Audiogram icon, linear isolated illustration, thin line vector, web design sign, outline concept symbol with editable stroke on white background.
-
 Cartesian coordinate system icon in filled, thin line, outline and stroke style. Vector illustration of two colored and black cartesian coordinate system vector icons designs can be used for mobile,
-
 Gaussian function outline vector icon. Thin line black gaussian function icon, flat vector simple element illustration from editable education concept isolated stroke on white background
-
 Two color smooth line chart vector icon from business concept. i
-
 Gaussian function icon in filled, thin line, outline and stroke style. Vector illustration of two colored and black gaussian function vector icons designs can be used for mobile, ui, web
-
 Grid, Graph, Drawing, area, software Business Flat Line Filled
-
 Probability vector line icon, sign, illustration on background, editable strokes
-
 Wave chart color vector doodle simple icon
-
 Coordinate Geometry line icon. linear style sign for mobile concept and web design. Hyperbola, axis outline vector icon. Symbol, logo illustration. Vector graphics
-
 Marketing mix chart icon color outline vector
-
 Grid, Graph, Drawing, area, software Icons. Flat and Line Fille
-
 Scatter plot vector icon modern illustration
-
 Scatter plot super basic orbit color vector icon. Illustration symbol design template for web mobile UI element. Perfect color modern pictogram on editable stroke.
-
 Set line Mathematics function sine icon isolated on blue background. Abstract banner with liquid shapes. Vector Illustration.
-
 Set line Mathematics function cosine icon isolated on blue background. Abstract banner with liquid shapes. Vector Illustration.
-
 Vector illustration of graph chart
-
 Scatter plot icon. Thin, Light Regular And Bold style design isolated on white background
-
 AI Function Approximation icon. Vector thin line illustration on a round dark blue background. Symbolizes the process where an AI model approximates (smooth curves) an unknown function based on given data points (scatter plot)
-
 Line Style Scatter Plot Diagram Data Point Graph Icon
-
 Scatter plot correlation diagram line icon representing statistical data distribution analysis research variables mathematical function metric coordinates business reporting chart
-
 Minimalist Outline Scatter Plot Graph with Regression Curve Line and Data Points Icon Symbol
-
 Mathematical diagram illustrating the intermediate value theorem with a red continuous function curve, dotted line, and blue intersection points.
-
 Scatter Plot Line Icon, Outline Symbol for Data Distribution, Statistical Correlation, Variable Research, Scientific Analysis, and Pattern Visualization. Vector Sign Icon.
-
 Business chart with line plot and bars robot pointing, and coin with dollar symbol. Ideal for financial technology, data analysis, investment, automation, AI, economy, and market trends. Line
-
 Minimalist vector illustration of absolute value function graph y equals x with yellow V-shaped line on coordinate axes over white background
-
 Minimalist vector graph of tangent function wave on a transparent background. Light blue curves of tan x plot grow upwards between grey asymptotes
-
 Types of correlation. Strong, weak, and perfect positive correlation, strong, weak, and perfect negative correlation, no correlation. Scatter plot.
-
 Data Science and Business Metrics. Professional collection of statistics symbols representing strategic planning plus organizational intelligence for digital growth.
-
 Simple Line Style Scatter Plot Graph Data Analysis Icon
-
 Gauss distribution. Standard normal distribution. Gaussian bell graph curve. Business and marketing concept. Math probability theory. Editable stroke. Vector illustration isolated on white background
-
 Wavy graphics
-
 Cartesian coordinate system. vector illustration. template for drawing graphs of trigonometric functions
-
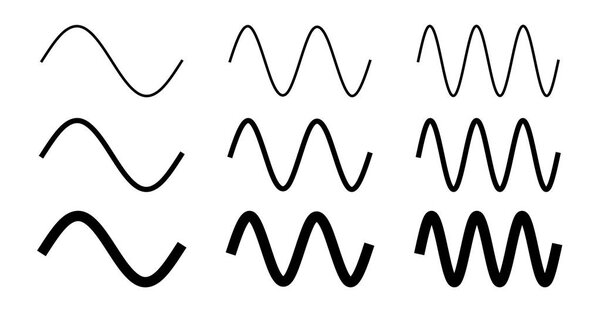 Simple sine wave drawing. One, two and three period with 3 different width.
-
 Normal Gauss distribution. Standard normal distribution. Gaussian bell graph curve. Vector illustration isolated on white background.
-
 Vector mathematical icons
-
 Engineering draft seamless pattern.
-
 Engineering draft seamless pattern. Geometric vector wallpaper or website background.
-
 Vector illustration of mathematics functions
-
 Simple cosine of x function graph. Wave with one, two and three periods, 3 stroke weight versions.
-
 Big data information streams network
-
 Cosine vector icon editable stroke outline icons for web and mobile
-
 Outlier graphic result as different statistics data point tiny person concept
-
 Gauss distribution. Math probability theory. Standard normal distribution. Gaussian bell graph curve. Business and marketing concept. Vector illustration. EPS 10. Stock image.
-
 Graph of Threshold energy and Progress of Reaction
-
 Gauss distribution. Standard normal distribution on a green school board. Math probability theory for tech university. Vector illustration isolated on green school background
-
 Cloud signal server business investment management system
-
 Logarithm vector icon. Flat style illustration. EPS 10 vector.
-
 Rectangular Coordinate Systems and Graphs. Flat vector illustration.
-
 Hyperbola outline icon. Symbol, logo illustration for mobile concept and web design.
-
 Vector illustration of seo icon
-
 Blue Scratched Nothing Stamp and Web Carcass Cartesian Axes
-
 Vector Outline Cartesian Axes Icon and Distress Empty Stamp
-
 Marketing mix graph icon color outline vector
-
 Cartesian axes icon, outline style
-
 Cosine icon vector, filled flat sign, solid pictogram isolated on white, logo illustration. Cosine icon for presentation.
-
 Sine icon of 3 types. Isolated vector sign symbol.
-
 Cartesian coordinate system vector icon editable stroke outline icons for web and mobile
-
 Seamless blueprint grid pattern, mathematical square coordinate paper texture .
-
 Education, graphic design, data , digital tools, analytics, drafting. Illustration of a pen, browser window layout and graph. Graphic design and data ation concept
Each vector opens in a new tab with its details. Premium files are sold by Depositphotos; we may earn a commission if you buy. How this works.