Plot line science chart function vectors
87 plot line science chart function vector illustrations picked from 4M royalty-free files, with no more than 3 per artist so you see real variety. Every file is a scalable EPS that opens in Illustrator, CorelDRAW, Affinity Designer and Inkscape, and exports to SVG or PNG at any size.
-
 Vector statistical icons of correlation types. Positive, negative, no correlation. The relationship between two data sets or two random variables. Graphs or charts.
-
 Mathematical function Vector Style Black thin line
-
 Coordinate grid template chart to analyze the chart
-
 Cartesian coordinate system. vector illustration. template for drawing graphs of trigonometric functions
-
 Set line Mathematics function cosine, Chalkboard and Mathematics function sine. Business infographic template. Vector
-
 Scatter plot shows a perfect degree of positive correlation
-
 Line Plot Eps Vector Icon
-
 Vector illustration of mathematics functions
-
 Line Mosaic Gauss Plot
-
 Degree of correlation. Scatter plot
-
 Cartesian coordinate system plane chart axis diagram white.
-
 Cartesian coordinate system icon. Thin linear cartesian coordinate system outline icon isolated on white background from education collection. Line vector sign, symbol for web and mobile
-
 Simple cosine of x function graph. Wave with one, two and three periods, 3 stroke weight versions.
-
 Gaussian function vector icon in 6 different modern styles. Black, two colored gaussian function icons designed in filled, outline, line and stroke style. Vector illustration can be used for web,
-
 Scatter plot shows a weak degree of positive correlation
-
 Linear Function Plot Vector Mesh
-
 Sinusoid plot line vector doodle simple icon
-
 Set line XYZ Coordinate system, Function mathematical symbol and Mathematics function cosine. Business infographic template. Vector
-
 Set line Calculator, Mathematics function sine and Graph, schedule, chart, diagram. Business infographic template. Vector.
-
 Probability icon vector from risk management collection. Thin line probability outline icon vector illustration. Outline, thin line probability icon for website design and mobile, app development
-
 Cartesian coordinate system vector icon in 6 different modern styles. Black, two colored cartesian coordinate system icons designed in filled, outline, line and stroke style. Vector illustration can
-
 Grid, Graph, Drawing, area, software Line icon with 5 steps pres
-
 Smooth line chart icon in different style vector illustration. t
-
 Cartesian coordinate system icon in filled, thin line, outline and stroke style. Vector illustration of two colored and black cartesian coordinate system vector icons designs can be used for mobile,
-
 Gaussian function outline vector icon. Thin line black gaussian function icon, flat vector simple element illustration from editable education concept isolated stroke on white background
-
 Two color smooth line chart vector icon from business concept. i
-
 Outline gaussian function vector icon. isolated black simple line element illustration from education concept. editable vector stroke gaussian function icon on white background
-
 Gaussian function icon in filled, thin line, outline and stroke style. Vector illustration of two colored and black gaussian function vector icons designs can be used for mobile, ui, web
-
 Grid, Graph, Drawing, area, software Business Flat Line Filled
-
 Probability vector line icon, sign, illustration on background, editable strokes
-
 Wave chart color vector doodle simple icon
-
 Coordinate Geometry line icon. linear style sign for mobile concept and web design. Hyperbola, axis outline vector icon. Symbol, logo illustration. Vector graphics
-
 Grid, Graph, Drawing, area, software Icons. Flat and Line Fille
-
 Scatter plot vector icon modern illustration
-
 Set line Mathematics function sine icon isolated on blue background. Abstract banner with liquid shapes. Vector Illustration.
-
 Set line Mathematics function cosine icon isolated on blue background. Abstract banner with liquid shapes. Vector Illustration.
-
 Scatter plot icon. Thin, Light Regular And Bold style design isolated on white background
-
 AI Function Approximation icon. Vector thin line illustration on a round dark blue background. Symbolizes the process where an AI model approximates (smooth curves) an unknown function based on given data points (scatter plot)
-
 Scatter plot correlation diagram line icon representing statistical data distribution analysis research variables mathematical function metric coordinates business reporting chart
-
 Mathematical diagram illustrating the intermediate value theorem with a red continuous function curve, dotted line, and blue intersection points.
-
 Minimalist vector illustration of absolute value function graph y equals x with yellow V-shaped line on coordinate axes over white background
-
 Minimalist vector graph of tangent function wave on a transparent background. Light blue curves of tan x plot grow upwards between grey asymptotes
-
 Types of correlation. Strong, weak, and perfect positive correlation, strong, weak, and perfect negative correlation, no correlation. Scatter plot.
-
 A pink graph with a vertical and horizontal axis, showing a step function.
-
 Set of mathematical function graph on coordinate axis icons with different line weights. Data analysis, algebra, or geometry line art. Vector.
-
 Outline Scatter Plot Graph With Trend Line Data Representation Icon
-
 Line Simple Coordinate System Graph Diagram Chart Icon Symbol
-
 Positive and negative correlation graph. Geometric diagram with mathematical variable and information scatter functions with vector calculations
-
 Mathematics graph and hyperbola function icon in line design. Mathematics, graph, hyperbola, function, geometry, coordinate system, algebra on white background vector. Math editable stroke icon.
-
 Math geometry graphs collection set vector illustration. Linear, constant, logarithmic, exponential, square root, logistic function. Graphic presentation for math teachers.
-
 Scatter plot icon, black glyph vector chart with trend line and scatter points, statistical data analysis symbol, mathematical graph isolated on white
-
 A line graph showing a saturation curve with a purple gradient background.
-
 Hand Drawn Graph with X and Y Axes, Mathematical Curve Chart Illustration in Doodle Style. Isolated. Vector
-
 A graphic representation of a piecewise linear function with saturation on an orange circular background.
-
 Cartesian coordinate curve icon in line design. Curve, coordinates, graph, math, vertices, x axis, y axis on white background vector. Cartesian coordinate curve editable stroke icon
-
 Minimalist black sine wave graph on a white background. Mathematical function with axes, symbolizing oscillation, periodic motion, signal, physics, math education, and data visualization
-
 Line Style Simple Scatter Plot Graph Data Diagram Icon
-
 Mathematics graph and parabola function icon in line design. Mathematics, graph, parabola, function, geometry, coordinate system, algebra on white background vector. Math editable stroke icon.
-
 Magenta neon linear function graph grid background black. Bright pink diagonal linear graph line coordinate grid axes black background retro futuristic HUD interface visual
-
 Infographic Chart Changing Graphs, System of Axes
-
 Gaussian function vector icon isolated on transparent background
-
 Mathematical function graph on a transparent background
-
 Gaussian function icon vector isolated on white background, logo concept of Gaussian function sign on transparent background, filled black symbol
-
 Gaussian function icon in trendy design style. gaussian function icon isolated on transparent background. gaussian function vector icon simple and modern flat symbol for web site, mobile, logo, app, UI.
-
 Gaussian function icon vector isolated on white background for your web and mobile app design, Gaussian function logo concept
-
 Wavy graphics
-
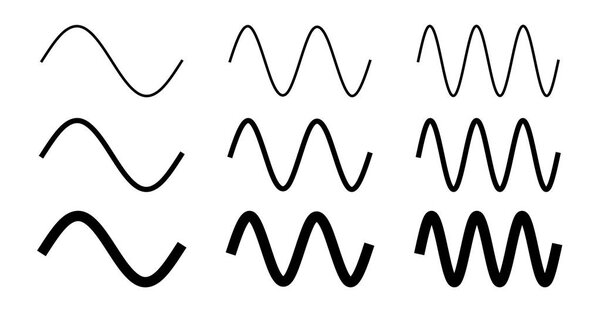 Simple sine wave drawing. One, two and three period with 3 different width.
-
 Cosine vector icon editable stroke outline icons for web and mobile
-
 Outlier graphic result as different statistics data point tiny person concept
-
 Logarithm vector icon. Flat style illustration. EPS 10 vector.
-
 Rectangular Coordinate Systems and Graphs. Flat vector illustration.
-
 Hyperbola outline icon. Symbol, logo illustration for mobile concept and web design.
-
 Vector illustration of seo icon
-
 Cosine icon vector, filled flat sign, solid pictogram isolated on white, logo illustration. Cosine icon for presentation.
-
 Sine icon of 3 types. Isolated vector sign symbol.
-
 Cartesian coordinate system vector icon editable stroke outline icons for web and mobile
-
 Graph showing curve with data points plotted
-
 Graph showing data points and curve fitting
-
 Hand-drawn mathematical graph illustrating a linear equation y mx plus b on Cartesian axes, featuring y-intercept (0 b) and point (x y) on a white background.
-
 Calculus diagram showing magenta shaded area under an exponential curve on coordinate axes x and y, isolated vector illustration on white background.
-
 Graph with sine wave plotted on axes inside blue circle.
-
 Check mark. simple illustration
-
 Collection of coffee cups each featuring a unique mathematical graph or symbol on its side, with steam rising from the hot drinks.
-
 Cartesian Grid Coordinate System. Blank Grid Paper. Black And White Geometric Square Grid Pattern
-
 Cartesian coordinate system on a notebook sheet on a checkered grid. Vector illustration
-
 Cartesian coordinate system icon vector isolated on white backgr
-
 Cartesian coordinate system vector icon isolated on transparent background, Cartesian coordinate system logo design
Each vector opens in a new tab with its details. Premium files are sold by Depositphotos; we may earn a commission if you buy. How this works.