Plot line vectors
100 plot line vector illustrations picked from 19.6M royalty-free files, with no more than 3 per artist so you see real variety. Every file is a scalable EPS that opens in Illustrator, CorelDRAW, Affinity Designer and Inkscape, and exports to SVG or PNG at any size.
-
 Plant a plant. Line icon, black, plant the plant in the soil, plant the plot. Vector icons.
-
 Data analytics icons including mining, machine learning, decision making, database, business intelligent, science, bar, line graph, scatter plot, histogram, pie chart, box, pyramid, average, variability, random sampling, frequency table, cluster
-
 Charts and Diagrams line icons. Report, 3D Chart, Block diagram and Dot Plot graph linear icons. Trend, Pyramid and Pie chart report symbols. Presentation infochart, process flow diagram. Vector
-
 Line Plot Eps Vector Icon
-
 Dot plot, Accounting report and Fan engine line icons set. Diploma certificate, save planet, group of people. Loan house, Cashback card and Payment card signs. Vector
-
 Technology icons set. Included icon as Multichannel, Demand curve, Dot plot signs. Bitcoin pay, Loud sound, Face biometrics symbols. Roller coaster, World communication line icons. Vector
-
 Scatter plots line icon vector illustration
-
 Set of 40 filled user interface web icons in glyph style such as data analytics cylinder, box plot chart interface, data analytics lines on spherical grid, data analysis pie chart interface, simple
-
 Horizontal Line is a straight line left and right that goes through the point, it is a function or plot ordered pairs without a coordinate plane, vintage line drawing or engraving illustration.
-
 Line Mosaic Gauss Plot
-
 Line Plot Vector Mesh Wire Frame Model and Triangle Mosaic Icon
-
 Graph paper blue background (Grid lines)
-
 Cosine wave line on bidimensional plane with two perpendicular axes. Trigonometric function graph. Checkered worksheet background. Cartesian coordinate system. Vector graphic illustration
-
 A Polar Graph with 5 concentric circles showing radius and divided into sections of 10 degree (labeled) each , vintage line drawing or engraving illustration.
-
 Mathematical function Vector Style Black thin line
-
 Details of a grid or matrix of blue horizontal and vertical lines, often us
-
 Line Flat Icons Statistic Elements Set 01
-
 A Polar Graph with 5 concentric circles showing radius and divided into sections of 30 degree (not labeled) each , vintage line drawing or engraving illustration.
-
 Box plot icon in different style vector illustration. two colore
-
 2D pixel perfect customizable black graph comparison with arrow symbols icon, isolated vector, thin line illustration representing comparisons.
-
 Graph, Diagram & chart icons set in thin line style
-
 Candlestick chart chalk icon. Box plot graph. Business diagram.
-
 Infographic design element collection. Vector flat color illustration set. Dotted line, stacked area chart on white. Alluvial sankey diagram. Design for ui, science poster, marketing, presentation
-
 Scatter plot shows a perfect degree of positive correlation
-
 Infographic element collection. Vector flat color illustration set. Dotted line, stacked area, gantt chart on white. Process, timeline diagram. Design for ui, science poster, marketing, presentation
-
 Data chart types brief diagram showing column bars, scatter plot, and pie chart, a concise visual guide to common graphs for analysis. Outline diagram
-
 Icon plot area in acres, square metres. Vector icon
-
 Strategy & planing icon set in thin line style
-
 Seamlesly repeatable diagonal, oblique, slanting lines graph pap
-
 Vector set on the theme of cleaning services, tourism, music, fast food, books, stationery, household appliances. Isolated doodles for use in design. Line art
-
 Set Of 9 simple editable icons such as Safe box, Data analytics, Chart, Box plot chart, Pie graphic with four areas, Data import interface, Global user, Bars, Bars chart
-
 School concept - line design icons set
-
 Criss-cross, bisect, crosshatch lines grid, mesh. Regular graph-
-
 Architecture line background. Building construction sketch vector abstract. Modern city 3d project. Technology geometric grid. Wire blueprint house. Digital architect innovation wireframe.
-
 Set of 40 flat user interface web icons in line style such as data analytics cylinder, data writing board interface, data connected circular interface, speech bubble with three dots inside,
-
 Intersecting lines regular lattice, grating. Plotting, measureme
-
 Home, Road Repair - Thick Line Icons Set
-
 Set Of 9 simple editable icons such as Data export with an arrow, Safe box, Data analytics, Pie chart information on money, User warning, Box plot chart, Bars and data analytics, Chart, Stream graphic
-
 Layout Vector Line Icons 1
-
 Happy Growing up schedule. Isolated vector illustration Flat line icon concept of Success, Growth or Increase.
-
 Diagrams line icons. Business data chart pie increase analytic candlestick chart trend information graph. Diagram vector
-
 Landscape design, icons, line, color, vector.
-
 100 ui outline icons set such as web crawler, 3d data analytics dual bars, data search for interface, bars and line ascending of data analytics, analysis pie chart interface, multiple variable
-
 Line icons about farm. Contains such icons as tractor, windmill, vegetables, handmade products and animals Editable stroke. Vector - 64 pixel perfect grid
-
 Simple set of graph related, pie diagram, bar charts and graphs line icons. Can be widely used for representing data in many areas such as statistics, data science, math, economics, market. 48x48 Pixel perfect icon, editable stroke. Vector.
-
 Line Diagram Icons
-
 Security icons set. Vector flat line illustrations.
-
 Statistical chart vector icon in 6 different modern styles. Black, two colored statistical chart icons designed in filled, outline, line and stroke style. Vector illustration can be used for web,
-
 Diagram showing plot of potential energy vs reaction coordinate
-
 2D editable black big thin line icons set representing construction cost, isolated simple vector, linear illustration.
-
 Simple Set of Charts and Diagrams Related Vector Line Icons. Linear Pictogram Pack. Editable Stroke. 48x48 Pixel Perfect Icons.
-
 Cartesian coordinate system icon. Thin linear cartesian coordinate system outline icon isolated on white background from education collection. Line vector sign, symbol for web and mobile
-
 Box and whisker plot diagram
-
 Gaussian function vector icon in 6 different modern styles. Black, two colored gaussian function icons designed in filled, outline, line and stroke style. Vector illustration can be used for web,
-
 Car overpass, industrial panorama, infrastructure, urban plot, train move
-
 Abstract technology data visualization background. network futuristic wireframe. artificial intelligence. cyber security. visual information complexity. Intricate data threads plot.
-
 Statistician Market Research Icon Thin Line Vector
-
 Continuous one line woman sits on an armchair raising her legs on the table, plotting something. Conspiracy Planning. Vector illustration.
-
 Continuous one line woman is plotting something. Conspiracy Planning. Vector illustration.
-
 Scatter plot shows a weak degree of positive correlation
-
 Grid chart line icon, grid chart line symbol, grid chart line vector, grid chart line eps, grid chart line image, grid chart line logo, grid chart line flat, grid chart line art design
-
 Home, Road Repair - Thin Line Icons Set
-
 Continuous one line man in a confident pose. Vector illustration.
-
 Graph and plotting paper.
-
 Graph grid paper background
-
 Graph paper, seamless.
-
 Blue checkered background. Trendy texture for creative banners. Contemporary vibrant color
-
 Seamless Graph and plotting paper.
-
 Print Building view with landmark of Coatzacoalcos is the city in Mexico. Hand drawn sketch illustration in vector.
-
 Coordinate grid template chart to analyze the chart
-
 A7 graph paper vector
-
 Square background. Pattern background similar to paper.
-
 Graph paper background vector
-
 Blank cartesian coordinate system in two dimensions. Rectangular orthogonal coordinate plane with axes X and Y on squared grid. Math scale template. Vector illustration isolated on white background.
-
 Cartesian coordinate system in two dimensions with sample points. Rectangular orthogonal coordinate plane with axes X and Y on squared grid. Vector illustration isolated on white background.
-
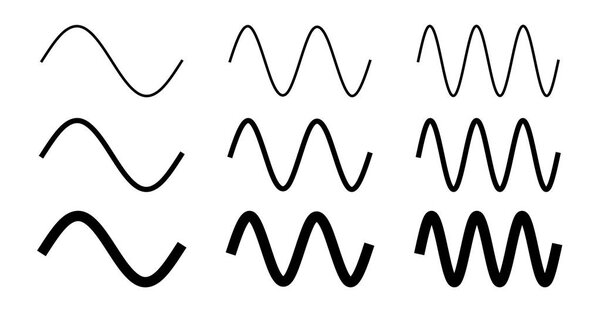 Simple sine wave drawing. One, two and three period with 3 different width.
-
 Infographic icons set on white background
-
 Tie Dye Pattern.
-
 Cartesian coordinate system. vector illustration. template for drawing graphs of trigonometric functions
-
 Wavy graphics
-
 HUD Futuristic Header, Footer for Infographic Information Work Report, Game, UI, Technology Frame.
-
 Hand drown Sketch
-
 Round radar chart, Kiviat diagram or spider graph template isolated on white background. Method of comparing items on different characteristics. Vector graphic illustration
-
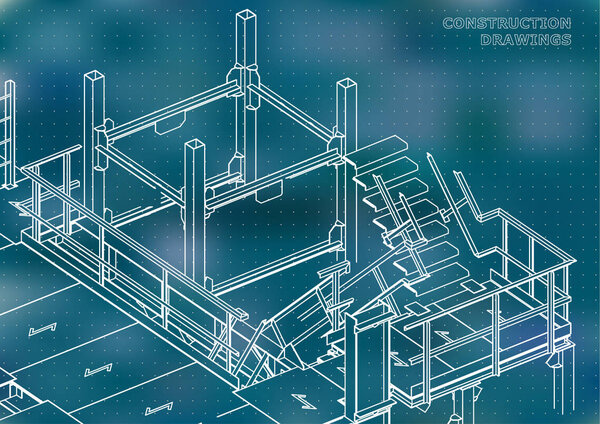 Building. Metal constructions. Volumetric constructions. Blue background. Points
-
 Engineering drawing. Blueprints. Cover. Engineering design
-
 Dimension editable stroke outline icon isolated on white background flat vector illustration. Pixel perfect. 64 x 64.
-
 Vector statistical icons of correlation types. Positive, negative, no correlation. The relationship between two data sets or two random variables. Graphs or charts.
-
 Vector flat pie chart diagram icon set illustration . Black round and circular pictograms isolated on white background. Concept of finance statistics, analitics. Design element for ui, report, web.
-
 House Blueprint Sketch. An outline of a dwelling on a rolled building document. This graphic signifies meticulous preparation, innovative growth, and property aspirations.
-
 Coordinate axes. Geometric green cartesian scale with blue analytical system in xyz.
-
 Mathematis symbols, geometrical shapes and school supplies seamless pattern on dark blue background.
-
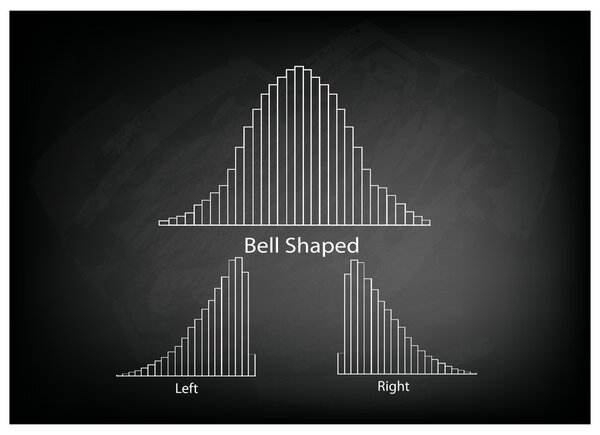 Collection of Positve and Negative Distribution Curve on Chalkboard
-
 Statistics icon. Chart symbol modern, simple, vector, icon for website design, mobile app, ui. Vector Illustration
-
 Business and Marketing Concepts, Collection of Positive and Negative Distribution or Normal Distribution Curve and Not Normal Distribution Curve Isolated on White Background
-
 Mechanical engineering drawing
-
 Files and folders 4
-
 Collection of 4 Normal Distribution Curve or Bell Curve
-
 Business graph icons
-
 Gauss distribution. Standard normal distribution. Gaussian bell graph curve. Business and marketing concept. Math probability theory. Editable stroke. Vector illustration isolated on white background
-
 Abstract background
Each vector opens in a new tab with its details. Premium files are sold by Depositphotos; we may earn a commission if you buy. How this works.