Plot line graph vectors
100 plot line graph vector illustrations picked from 5.6M royalty-free files, with no more than 3 per artist so you see real variety. Every file is a scalable EPS that opens in Illustrator, CorelDRAW, Affinity Designer and Inkscape, and exports to SVG or PNG at any size.
-
 Data analytics icons including mining, machine learning, decision making, database, business intelligent, science, bar, line graph, scatter plot, histogram, pie chart, box, pyramid, average, variability, random sampling, frequency table, cluster
-
 Charts and Diagrams line icons. Set of 3D Chart, Block diagram and Dot Plot graph icons. Vector
-
 Charts and Diagrams line icons. Report, 3D Chart, Block diagram and Dot Plot graph linear icons. Trend, Pyramid and Pie chart report symbols. Presentation infochart, process flow diagram. Vector
-
 Charts and Diagrams line icons. Report, 3D Chart, Block diagram and Dot Plot graph linear icons.
-
 Line chart and Diagram duotone icons.
-
 Graph of progress
-
 Line chart and Diagram icons on green background.
-
 Line chart and Diagram circle icons.
-
 2D pixel perfect customizable black graph comparison with arrow symbols icon, isolated vector, thin line illustration representing comparisons.
-
 Graph and plotting paper.
-
 Graph grid paper background
-
 Graph paper, seamless.
-
 Seamless Graph and plotting paper.
-
 A7 graph paper vector
-
 Graph paper background vector
-
 Graph paper blue background (Grid lines)
-
 Cosine wave line on bidimensional plane with two perpendicular axes. Trigonometric function graph. Checkered worksheet background. Cartesian coordinate system. Vector graphic illustration
-
 Mathematical function Vector Style Black thin line
-
 Line Flat Icons Statistic Elements Set 01
-
 Chart and graph chalk icons set. Radial diagram with increasing
-
 Cartesian coordinate system. vector illustration. template for drawing graphs of trigonometric functions
-
 Vector statistical icons of correlation types. Positive, negative, no correlation. The relationship between two data sets or two random variables. Graphs or charts.
-
 A Polar Graph with 5 concentric circles showing radius and divided into sections of 10 degree (labeled) each , vintage line drawing or engraving illustration.
-
 Graph, Diagram & chart icons set in thin line style
-
 Candlestick chart chalk icon. Box plot graph. Business diagram.
-
 Infographic design element collection. Vector flat color illustration set. Dotted line, stacked area chart on white. Alluvial sankey diagram. Design for ui, science poster, marketing, presentation
-
 Scatter plot shows a perfect degree of positive correlation
-
 Details of a grid or matrix of blue horizontal and vertical lines, often us
-
 Infographic element collection. Vector flat color illustration set. Dotted line, stacked area, gantt chart on white. Process, timeline diagram. Design for ui, science poster, marketing, presentation
-
 Data chart types brief diagram showing column bars, scatter plot, and pie chart, a concise visual guide to common graphs for analysis. Outline diagram
-
 Gauss distribution. Standard normal distribution. Gaussian bell graph curve. Business and marketing concept. Math probability theory. Editable stroke. Vector illustration isolated on white background
-
 Round radar chart, Kiviat diagram or spider graph template isolated on white background. Method of comparing items on different characteristics. Vector graphic illustration
-
 Normal Gauss distribution. Standard normal distribution. Gaussian bell graph curve. Vector illustration isolated on white background.
-
 Line Diagram Icons
-
 Simple Set of Charts and Diagrams Related Vector Line Icons. Linear Pictogram Pack. Editable Stroke. 48x48 Pixel Perfect Icons.
-
 Square area icon. Coordinate axes sign. Coordinate system Flat math graph icon. Measuring land area. Place dimension pictogram. Vector outline illustration isolated on white background.
-
 Abstract business analytics and statistics diagrams. Data statistic financial graph concept, chart and plot infographic. Vector illustration
-
 Line Graph Icons
-
 Business graph icon set vector
-
 Word Vegan, graph with plotted points, rising trend line, and buildings with upward arrows. Ideal for trends, veganism growth, business, sustainability, eco-friendly market analysis abstract line
-
 Charts, graphs, and presentation elements sketch
-
 Business ratings graphs and charts
-
 Data visualization charts 2D cartoon objects set. Piechart, bar graphs, scatter plots. Trend analysis diagrams isolated elements flat vector cliparts on white background. Spot illustrations collection
-
 Business Data Statistics, Chart and Plots Images
-
 Pixel perfect, editable stroke, up scalable, line, vector bloop icon.
-
 Plot of the love of the duration of family life
-
 Set Of 9 simple editable icons such as Cart graphic, Data connection, Data analytics ascending, Data analytics, Safe box, Sun Flare, Box plot chart, Pie graphic comparison, Database Analysis
-
 Set line Mathematics function cosine, Chalkboard and Mathematics function sine. Business infographic template. Vector
-
 Plot of love of the duration family life with the baby
-
 A Polar Graph with 5 concentric circles showing radius and divided into sections of 30 degree (not labeled) each , vintage line drawing or engraving illustration.
-
 Plot diagram vector illustration. Labeled story flow process explanation.
-
 Box plot icon in different style vector illustration. two colore
-
 A Polar Graph with 7 concentric circles showing radius and divided into sections of 30 degree (labeled) each , vintage line drawing or engraving illustration.
-
 Statistics - line icon set. Collection of 25 graphs/charts/diagrams. Infographics, data analysis, stats tools. Isolated on white background. Vector illustration.
-
 Line chart with up arrow. Vector illustration.
-
 Diagrams line icons. Business data chart pie increase analytic candlestick chart trend information graph. Diagram vector
-
 Collection of 16 Line Chart Icons Banner
-
 Line dot chart vector icon isolated on transparent background, L
-
 Timetable chart with three graphs
-
 Grid chart line icon, grid chart line symbol, grid chart line vector, grid chart line eps, grid chart line image, grid chart line logo, grid chart line flat, grid chart line art design
-
 Economic finance graphics chart icon. Market sale diagram graph for presentation. Vector
-
 Simple set of graph related, pie diagram, bar charts and graphs line icons. Can be widely used for representing data in many areas such as statistics, data science, math, economics, market. 48x48 Pixel perfect icon, editable stroke. Vector.
-
 Diagram, the arrow and graph on a white background.
-
 Graph, millimeter and plotting paper.
-
 Set Of Graphs, Diagrams And Statistics Icons. Premium Quality Symbol Collection. Icons Can Be Used For Web, App And UI Design. Vector Illustration, EPS10.
-
 Line Mosaic Gauss Plot
-
 Set Of 9 simple editable icons such as Safe box, Data analytics, Chart, Box plot chart, Pie graphic with four areas, Data import interface, Global user, Bars, Bars chart
-
 Combined graph black icon concept. Combined graph flat vector symbol, sign, illustration.
-
 Set Of 9 simple editable icons such as Data export with an arrow, Safe box, Data analytics, Pie chart information on money, User warning, Box plot chart, Bars and data analytics, Chart, Stream graphic
-
 Line Collage Dotted Negative Trend Icon
-
 Hand-drawn graph and chart types vector template 1
-
 Very thin line grap paper grid lines, plotting paper background,
-
 Line Plot Eps Vector Icon
-
 Strategy & planing icon set in thin line style
-
 Criss-cross, bisect, crosshatch lines grid, mesh. Regular graph-
-
 Seamlesly repeatable diagonal, oblique, slanting lines graph pap
-
 Diagram showing plot of potential energy vs reaction coordinate
-
 Degree of correlation. Scatter plot
-
 Statistical chart vector icon in 6 different modern styles. Black, two colored statistical chart icons designed in filled, outline, line and stroke style. Vector illustration can be used for web,
-
 Cartesian coordinate system icon. Thin linear cartesian coordinate system outline icon isolated on white background from education collection. Line vector sign, symbol for web and mobile
-
 Happy Growing up schedule. Isolated vector illustration Flat line icon concept of Success, Growth or Increase.
-
 Scatter plots line icon vector illustration
-
 Scatter plot shows a weak degree of positive correlation
-
 Set of 40 filled user interface web icons in glyph style such as data analytics cylinder, box plot chart interface, data analytics lines on spherical grid, data analysis pie chart interface, simple
-
 Simple cosine of x function graph. Wave with one, two and three periods, 3 stroke weight versions.
-
 Normal distribution graph color vector doodle simple icon
-
 Gaussian function vector icon in 6 different modern styles. Black, two colored gaussian function icons designed in filled, outline, line and stroke style. Vector illustration can be used for web,
-
 Chart and Diagram Icon
-
 Coordinate grid template chart to analyze the chart
-
 Square background. Pattern background similar to paper.
-
 Blank cartesian coordinate system in two dimensions. Rectangular orthogonal coordinate plane with axes X and Y on squared grid. Math scale template. Vector illustration isolated on white background.
-
 Infographic icons set on white background
-
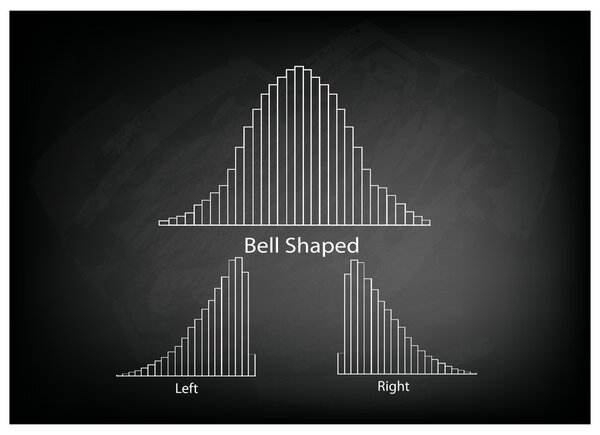 Collection of Positve and Negative Distribution Curve on Chalkboard
-
 Statistics icon. Chart symbol modern, simple, vector, icon for website design, mobile app, ui. Vector Illustration
-
 Business and Marketing Concepts, Collection of Positive and Negative Distribution or Normal Distribution Curve and Not Normal Distribution Curve Isolated on White Background
-
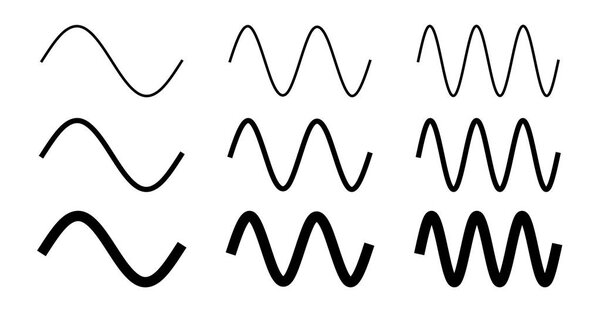 Simple sine wave drawing. One, two and three period with 3 different width.
-
 Infographic element collection. Vector flat color illustration set. Column bar chart isolated on white. Histogram and process diagram. Design for ui, science poster, marketing, presentation
-
 Coordinate axes. Geometric green cartesian scale with blue analytical system in xyz.
-
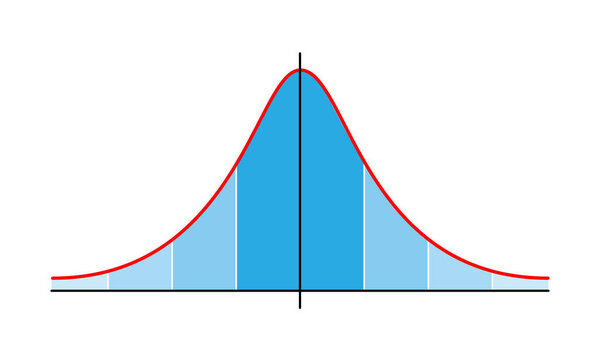 Gauss distribution. Standard normal distribution. Distribution standard gaussian chart. Bell curve symbol. Vector illustration isolated on white background.
-
 Gauss distribution. Distribution standard gaussian chart. Standard normal distribution. Bell curve symbol. Vector illustration. stock image. EPS 10.
Each vector opens in a new tab with its details. Premium files are sold by Depositphotos; we may earn a commission if you buy. How this works.