Index data chart vectors
100 index data chart vector illustrations picked from 9.4M royalty-free files, with no more than 3 per artist so you see real variety. Every file is a scalable EPS that opens in Illustrator, CorelDRAW, Affinity Designer and Inkscape, and exports to SVG or PNG at any size.
-
 Stock exchange board, market index graphs and charts, vector background. Stock exchange board prices on screen display, tickers, financial data numbers and electronic trade rates
-
 Stock exchange board with market index, graphs and charts. Vector background with trade tickers, currency rate growth and drop on black display. Trading data with bonds prices, financial investment
-
 Stock exchange board, market index graphs and charts, vector background. Stock exchange board display with prices and currency financial data of electronic trade rates
-
 Data analysis bundle of isometric elements. Growing chart, business infographics, research tools, analytic data, financial index isolated icons. Isometric vector illustration kit with people character
-
 Data analysis, statistics, analytics - minimal thin line web icon set. Outline icons collection. Simple vector illustration
-
 Infographic elements data visualization template
-
 Business process chart infographics with 5 step options. Workflow graphic elements. Can be used for info graphics, flow charts, presentations, web sites, banners, printed materials.Vector illustration
-
 Stock market graph or forex trading chart for business and financial concepts. Stock market data. Bullish point, Trend of graph. Vector illustration
-
 Stock market or forex trading graph. Chart in financial market vector illustration Abstract finance background
-
 Illustration of financial chart of growing and falling market. Blue display of trend index on white background - vector
-
 Abstract financial chart with uptrend line graph on blue background.
-
 Forex chart backdrop with candlestick and index grid.
-
 Technical analyze graphic with candlestick chart illustration. market volatility chart for stock trading, cryptocurrency background.
-
 Stock market investment trading graph or forex graph global network line wire frame data business concept for financial investment economic trends vector illustration
-
 Stock market and forex candlestick chart graph. Digital trading, global economy, business finance, financial investment concept. Vector illustration
-
 Crypto market candlestick chart on dark background. red-green candlesticks with upside arrow indicate. analysis, investment, trading, cryptocurrency, business finance
-
 Business candlestick stock chart on dark background. stock investment trading. up trend concept.
-
 Financial trade concept. Stock market and exchange. Candle stick graph chart.
-
 Business candle stick graph chart of stock market investment trading with world map. Stock market and exchange. Stock market data. Trend of graph. Vector illustration for your design
-
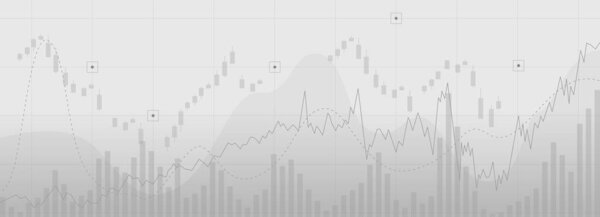 Trend line graph on gradient background, line chart diagram financial chart with sideways line graph and candlestick.
-
 Stock market investment trading illustration concept. Financial bar chart, yield curves, bond data, and upward-sloping graph on a white background. Business candlestick trend graph
-
 Business candle stick graph chart of stock market investment trading on blue background. Bullish point, up trend of graph. Economy vector design.
-
 Business candle stick graph chart of stock market investment trading, Bullish point, Bearish point. trend of graph vector design.
-
 Abstract infographic visualization. Financial chart with uptrend line graphs and candlesticks. Futuristic network or business analytics. Graphic concept for your design.
-
 Abstract financial chart with uptrend line graph and candlestick on black and white color background. Vector
-
 World stock market index graph. Candlestick chart, line graph and bar chart. Stock market growth illustration. Financial market background. Blue color. Vector illustration
-
 World stock market index graph. Candlestick chart, line graph and bar chart. Glow light. Stock market growth illustration. Financial market background. Dark Blue color. Vector illustration
-
 Illustration of orange business chart of growth and fall in stock, money or commodity prices with lines and background change - vector
-
 Business candle stick graph chart of stock market investment trading on blue background. Bullish point, Trend of graph. Eps10 Vector illustration.
-
 Stock market or Forex trading graph chart suitable for financial investment concept. Economy trends background for business idea. Abstract finance background. Vector illustration.
-
 World business graph or stock market chart or forex trading graph in graphic concept. Financial investment or business economic trend candlestick graph. Business idea and technology innovation design.
-
 World stock market index graph. Candlestick chart, line graph and bar chart. Stock market growth illustration. Financial market background. Dark Blue color. Vector illustration
-
 Chart and graph chalk icons set. Radial diagram with increasing
-
 Illustration of blue growth index or graph. Investment or stock
-
 Bar financial data graph. Forex stock crypto currency trade pattern triangle.
-
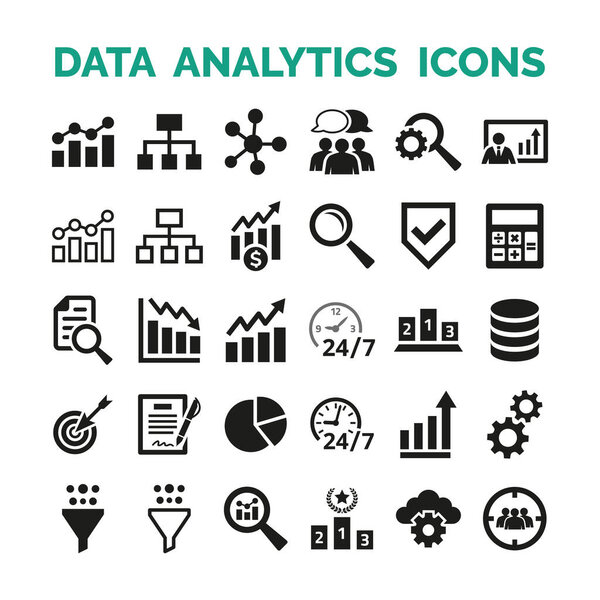 Data analytics icons set on white background. Vector Illustration
-
 Stock market or forex trading graph in futuristic concept for financial investment or economic trends business idea. Financial trade concept. Stock market and exchange Candle stick graph chart vector.
-
 Stock market background or forex trading business graph chart for financial investment concept of Uzbekistan map. business idea and technology innovation design.
-
 Horizontal banner stock market or forex trading platform. Dashboard with online trading, investment, market monitoring and analysis and real-time data. Banner stock exchange and binary option. Vector
-
 Financial chart with uptrend line graphs and candlesticks. Abstract infographics visualization. Graphic concept for your design
-
 Stock market candlestick chart vector illustration. Buy and sell indicators for trade on the chart. Financial diagram with assets values moving up and down.
-
 Stock market or forex trading graph and candlestick chart suitable for financial investment concept. Economy trends background for business idea and abstract finance background. Vector illustration.
-
 Infographic elements data visualization vector design template. Can be used for steps, options, business processes, workflow, diagram, flowchart concept, timeline, marketing icons, info graphics.
-
 Business financial blue abstract background with uptrend candle stick pattern of stock market, investment growth success finance business chart
-
 Stock exchange vector background. Stock market candlestick chart. Buy and sell indicators for trade on the chart. Financial diagram with assets values moving up and down. Vector illustration.
-
 Paris, France - october 28, 2019: stock market index and real rates with a green shade
-
 Financial data graph chart on grey background. Business background with candlesticks chart for reports and investment. Financial market trade concept.
-
 Business financial stock trading chart with ascending graph and growth lines on white background.
-
 Laptop trading chart on screen in 3D cartoon realistic style. Candle stick diagram cryptocurrency market analysis. Financial management and investment concept. Vector illustration
-
 Stock market trading technical analysis bar chart fall. Business exchange candlestick graph downtrend. Crisis economy and investment loss graph. Trader financial index crash banner. Black background
-
 World Map with Financial Data Graph Chart on Blue Background.
-
 Stock market growth in futuristic technology style. Successful financial graphic on blue background. Business growth illustration with the bar chart static and up arrow.
-
 Business investment forex trading chart on blue dark background. trading stock technology and finance. candlestick chart economic concept. digital income and profit graphs. vector illustration.
-
 Stock trading japanese candlesticks trading chart vector illustration isolated on white background
-
 Creative vector illustration of business data financial charts. Finance diagram art design. Growing, falling market stock analysis graphics set. Concept graphic report element. Profit summary tools
-
 Abstract financial graph with uptrend line,widescreen abstract chart and candlestick on gradeint color background
-
 Black laptop with candlestick chart on screen and 3D pie diagram. Stock market analysis and success business investment. Render laptop with online trading app. Vector
-
 Business data analytics. Financial graph chart. Graph chart of stock market investment trading. Abstract analisys and statistic diagram. vector illustration
-
 Stock market crypto candlestick chart and indicators on dark background. red-green candlesticks with digital technology concept, business growth, financial, investment
-
 Economy business crisis and graph investment down on red background. arrow trading chart candlestick fall. vector illustration fantastic technology.
-
 Stock market or forex trading business graph chart for financial investment concept. Business presentation for your design and text. Economy trends, business idea and technology innovation design.
-
 Stock market background or forex trading business graph chart for financial investment concept of India map. business idea and technology innovation design.
-
 Calculator and finance chart
-
 Financial chart with moving up arrow graph and world map in stock market on blue color background
-
 White Abstract Simple Uptrend Financial Chart Background
-
 A chart of stock market crypto candlesticks on a dark background. Analysis of investment trading in the field of cryptocurrencies, stocks and forex. Vector illustration
-
 Falling stock chart with a world map at the bottom indicates an economic recession, market volatility or financial crisis. Suitable for use in economic news, analysis reports, and global finance.
-
 Tablet PC Business chart, uptrend line graph
-
 Flat design concept stock exchang and trader. Financial market business with graph chart analysis. Vector illustrations.
-
 Financial Graph Chart
-
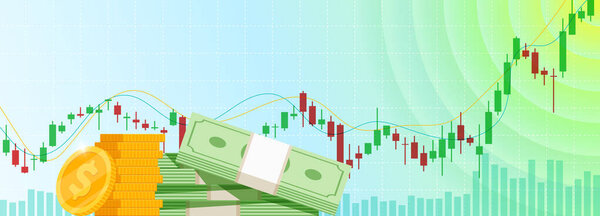 Stock market trading technical analysis bar growing candlestick chart. Business exchange bullish trend graph. Trader financial investment growth moving up index eps banner. Savings and income concept
-
 High detailed charts of growing markets, vector illustration
-
 Up trend arrow, economic future, Business candle stick graph chart of stock market investment trading, economy and investing background design. Bullish point, Trend of graph. Vector illustration
-
 Stock chart technology Bar charts that are placed on top of line charts. It conveys information on the company's growth in each quarter to make investors interested in investing more.
-
 Stock market investment trading technical analysis bar candlestick chart. Business exchange growing trend graph. Trader financial investment growth moving up index banner concept. Eps
-
 Abstract financial chart with blue uptrend numbers and gradient line graph vector illustration on white background.
-
 AI chip with candlestick chart graph with indicator. Stock market, forex trading, financial investment and Artificial Intelligence concept background. Vector illustration
-
 Candlestick chart. stock and line charts. colored financial graph
-
 Infographics tab in horizontal paper index with 4 data template. Vector illustration abstract notebook background. Can be used for workflow layout, business step, banner, web design.
-
 Candlestick chart graph with AI Artificial Intelligence chip for financial investment, stock market and forex trading concept background. Vector illustration
-
 Infographics tab in horizontal paper arrow with 6 data template. Vector illustration abstract notebook background. Can be used for workflow layout, business step, banner, web design.
-
 Modern template infographics design data presentation indicators
-
 Business chart illustration set
-
 A luxury, gold graph for Stock market charts and forex trading graph in up trend concept for financial investment or Economic trends business idea, For down trend grapghs
-
 Growth Chart vector flat Icon Design illustration.
-
 Candlestick treading index on computer monitor
-
 Stock chart green and red candles
-
 Isometric Investing and Stock Market Gain and Profits with Red and Green Candlestick Charts. Stock Exchange Market Graph, Analysis UI, UX on Laptop. Binary Option. App Screen for Trading
-
 Infographics tab in horizontal paper index with 5 data template. Vector illustration abstract notebook background. Can be used for workflow layout, business step, banner, web design.
-
 Hands hold tablet with flat simplistic inforgraphic charts on a
-
 Investment report with various infographics. Data visualization, commercial business analytics, financial graph, stock index cartogram vector illustration. Corporate business presentation template.
-
 Business Analysis, Stock Trading Symbol - Chart, Diagram on the Screen of a Laptop Computer and Mobile Phone
-
 Big data algorithms visualization technologies infographic analy
-
 Abstract background of relative strength index (RSI) stock market chart graph on white background
-
 Abstract financial chart with uptrend line graph in stock market on blue background. Business chart. Graph chart of stock market investment trading. Trend of graph vector design.
-
 Digital growth graph chart with up arrow on technology blue background. Business and financial concept. Stock market and investment symbol. Low poly wireframe vector illustration in futuristic style.
-
 Digital business analytics concept, data threads graphic visualization
-
 Digital analytics concept, data visualization, financial schedul
-
 Statistical data research, company performance indicators, return on investment. Percentage ratio, indexes fluctuation, significative change. Vector isolated concept metaphor illustration.
-
 Golden and luxury Stock market charts and forex trading graph in down trend concept for financial investment or Economic trend business idea, Abstract finance background
Each vector opens in a new tab with its details. Premium files are sold by Depositphotos; we may earn a commission if you buy. How this works.
