Financial analysis graph vectors
100 financial analysis graph vector illustrations picked from 6.9M royalty-free files, with no more than 3 per artist so you see real variety. Every file is a scalable EPS that opens in Illustrator, CorelDRAW, Affinity Designer and Inkscape, and exports to SVG or PNG at any size.
-
 Computer screen displaying bar charts, pie chart, and line graph, alongside a potted plant and a small cloud. Ideal for data presentation, financial analysis, business reports, performance metrics
-
 Calendar with grid, person holding Cash Back sign, and declining graph with blue nodes. Ideal for cashback promotions, financial planning, scheduling, business analysis, time management
-
 Financial analysis icon. Eps 10 vector illustration. Finance productivity graph, return on investment chart, budget planning, accounting report, income growth, statistic dashboard.
-
 Vector business template with illustration of financial graph and chart on white background with word financial analysis. Flat style creative design with text space for web, site, banner
-
 Vector business and finance design concept with big man and woman taking care of money plant. Brainstorming picture with cogs, graphs, diagrams, leaves. Financial analysis big data illustration.
-
 Financial analysis statistic map business people consultant graph diagram isometric successful analytics scheme concept horizontal banner flat
-
 Data analysis landing page vector template. Information chart and graph website header UI layout with isometric illustration. Accounting report, financial presentation web banner isometry concept
-
 Financial Graph Chart
-
 Business planning and business investment. graph with paper report
-
 Capital growth, interest rate, income increase, long term investment, financial analysis
-
 Business analysis background with magnifying glass, graphs and charts. Analytics report vector infographics.
-
 Business analysis, financial report
-
 Financial Analysis Monoflat Icon
-
 Financial Report Doodle Concept
-
 Business chart collection. Set of graphs. Data visualization.
-
 Financial stock market graph on stock market investment trading, Bullish point, Bearish point. trend of graph for business idea and all art work design. vector illustration.
-
 Business Analysis concept, People work in front of a big laptop. Auditing, Financial consulting flat vector illustration
-
 Business person analyzing financial statistics
-
 Vector Background with Graphs
-
 Financial Report Icon Graph Chart Vector Pack
-
 Vector illustration of a businessman standing in front of candlestick chart with buy and sell signals, symbolizing stock trading, market analysis and investment decision
-
 Global business growth and customer engagement concept with a globe, financial symbols, and digital connectivity.
-
 Flat vector illustration of a computer display showing data charts and analytics, representing business performance, reporting, and financial analysis, isolated on white background.
-
 Forward Looking Growth Analysis. Businessman with Telescope and Chart. Vector Business Illustration
-
 Multiple charts and graphs displayed on a digital interface, symbolizing data monitoring, business insights, and online analysis for strategic planning.
-
 Financial analysis concept. Documents, files with charts, diagrams, forms, calculator, pen and magnifying glass. Modern website template, web banner and flat icons set. Flat design vector illustration
-
 Financial planning, data analytics, automation, business management, technology, artificial intelligence. Screen with a spreadsheet, charts and robot assistant. Financial planning and data analytics
-
 Concepts for business analysis
-
 Data analysis flat line illustration
-
 Pile of cash red recession graph with downward arrow illustration
-
 Accounting and financial logo design template. Finance business logo design
-
 Data Analysis Glyph Icons
-
 Set of blue-themed financial graphs depicting data trends, including line and area charts. Illustrating business growth and analytics. Concept of economics, financial analytics and growth
-
 Financial Infographic set with charts
-
 Mobile charts UI. Phone screen with dashboard analytics, diagrams and bars with stock statistics and forecasts. Financial statement schemas for presentation, vector report templates
-
 Financial data analysis. Data and finance management concept. flat vector modern illustration
-
 Innovative pack of 36 vector icons themed around Financial Report, showcasing Bold Line design in 128x128 PIXEL perfect format for modern digital solutions.
-
 Graphs and charts.
-
 Isometric vector illustration on a blue background, chart with an up arrow inside a loop, financial analysis
-
 Tablet screen with graph and a hand. Vector.
-
 Financial analysis, business report, modern infographic, market statictics vector concept
-
 Business financial analysis data (hand drawn doodle elements) on a tablet. Vector file.
-
 Regression analysis graph vector icon
-
 Business strategy marketing plan concept top angle view desktop laptop smartphone tablet screen paper documents financial analysis report office stuff horizontal
-
 Financial Analysis colorful banner
-
 Market forecast, people analysing info chart and diagrams. Characters creating business marketing strategy. Financial analysis and report. Banking diagram, digital trading plan vector
-
 Vector of businessman and a businesswoman looking through a magnifying glass at financial document
-
 Financial analysis, fund management, return on investment, fund raising, risk assessment, stock market data, venture capital
-
 Accounting. Accountancy service. Banking Calculation. Financial analysis, investments and business consulting concept. Online banking. Robotic hand touching digital interface. Vector illustration.
-
 Accounting. Accountancy service. Banking Calculation. Financial analysis, investments and business consulting concept. Online banking. Wireframed cyborg hand touching digital interface. Vector.
-
 Financial analysis web concept in flat design. Woman and man analyzing data and making research, create strategy at meeting. Audit, investment and accounting. Vector illustration with people scene
-
 Display charts and graphs on a computer screen and analyzed by two employees. Concept of business accounting and statistics. Trend Modern vector flat illustration.
-
 Market analysis flat line icon
-
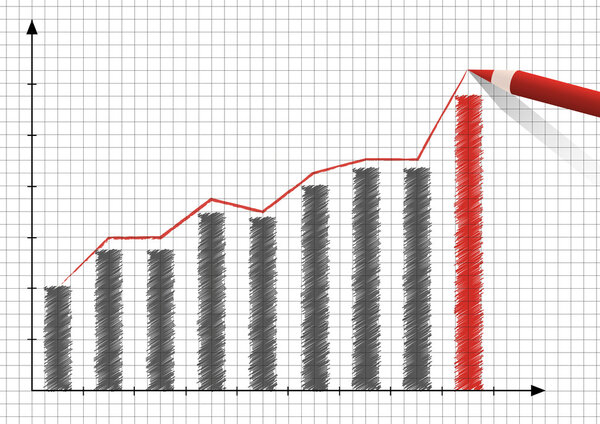 Graph up
-
 Concept of business profit, income business, startup, money, growth, developing your business, setting goals for financial success, investment growth, flat vector illustration banner.
-
 Rising graph simple web icon
-
 Business graph with arrow vector illustration
-
 Business statistic web design with people characters. Analytic team analyzing data scene. Financial research composition in flat style. Vector illustration for social media promotional materials.
-
 Flat Line Design Header - Financial Report
-
 Finance and engineering graph of economics. Statistic and sales manager for financial management concept. Economic infographic banner. Flat isometric concept with characters vector illustration.
-
 Forex stock market investment trading concept, Candlestick pattern with bullish and bearish is a style of financial chart.
-
 Financial statistics, analysis, business report vector concept
-
 Vector of business people financial analysts working as a team to achieve a company success
-
 Computer Monitor with Voice Graph. Online Business Presentation, Training or Seminar, Virtual Financial Consultation
-
 Stock Market Graph
-
 Tiny Business Characters with Huge Golden Coin near Grow Chart. Investment Strategy and Portfolio Analysis, Investment
-
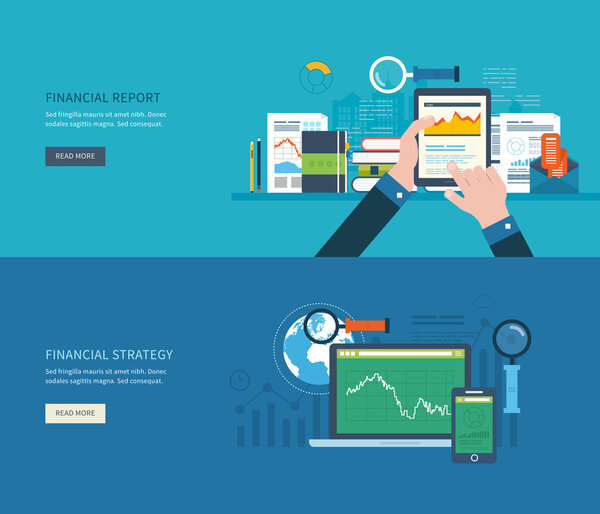 Analyzing project, financial report
-
 Businessman holding bar and pie chart. Financial report, marketing, analytics, statistics, research data, business analysis. Flat cute outline cartoon isolated vector illustration
-
 Market analytic report. Financial audit, marketing strategy review and finance business statistic isometric 3D vector illustration set
-
 Financial Graph
-
 Piggy bank with bitcoin vector cartoon outline illustration on background of rising bar graph. Money savings concept.
-
 Analysis Special lineal color icon. Illustration symbol design template for web mobile UI element. Perfect color modern pictogram on editable stroke.
-
 Set Flat 2D concepts Online chat, data analysis, data collection, digital marketing. For Concept for web design
-
 Business concept - retro magnifying glass, data analysis
-
 Flat color Modern Isometric Concept Illustration - Data Analysis
-
 Computer with stocks graphs and money vector illustration, flat cartoon pc monitor with stock charts growth arrow on screen, concept of success financial trading profit, good markets strategy income
-
 Business data analysis
-
 Bar financial data graph. Forex stock crypto currency trading pattern.
-
 Data analysis icon
-
 Business women analyzing financial data.
-
 Vector growing graph chart background.
-
 Business report, financial statistic, management, analytics vector concept
-
 Abstract background of stock market Investing Insights with magnifying glass and indicator technical analysis graph
-
 Technical Analysis Of Exchange Trade, stock market or stock exchange vector illustration
-
 Candle stick graph chart of stock market investment trading, Bullish point, Bearish point. trend of graph vector design.
-
 Flat isometric concept illustration. business development analysis data
-
 Illustration of stock market losses. Bankrupt financial information concept with arrows pointing down. Descending trading graph
-
 Accounting and finance auditing concept, calculating budget, profit and loss, generating report graph from data, professional, business person accountant with calculator, spreadsheet creation report.
-
 Calculating Business Technology Data Analysis
-
 Concept illustration of isometric computer data analysis
-
 Business financial blue abstract background with uptrend candle stick pattern of stock market, investment growth success finance business chart
-
 Stock market or forex trading graph chart suitable for financial investment concept. Economy trends background for business idea. Abstract finance background. Vector illustration
-
 Financial investment, analytics with growth report.
-
 Eye-catching abstract financial stock market chart featuring colorful candlestick patterns, symbolizing market trends and financial analysis - vector illustration
-
 Isometric Expert team for Data Analysis, Business Statistic, presentation and brainstorming to strategy planning making profit of company.
-
 Isometric graph chart vector illustration set, 3d infographic element, diagram bar with stats percent or graphic pie chart isolated on white
-
 Barrel of oil price chart vector illustration in flat style. Stock graph on laptop screen.
-
 Business candle stick graph chart of stock market investment trading on blue background. Bullish point, up trend of graph. Economy vector design.
-
 Set of bar charts. vector color business analysis column graph images
-
 Your Personal Data Analytics Illustration. Data Analyse. Financial Growth. White Template. Vector illustration
Each vector opens in a new tab with its details. Premium files are sold by Depositphotos; we may earn a commission if you buy. How this works.