Exchange graph vectors
100 exchange graph vector illustrations picked from 19M royalty-free files, with no more than 3 per artist so you see real variety. Every file is a scalable EPS that opens in Illustrator, CorelDRAW, Affinity Designer and Inkscape, and exports to SVG or PNG at any size.
-
 Loyalty card, Payment and Credit card line icons set. Web report, Calculator target and Analytics graph signs. Money exchange, Graph and Bitcoin project symbols. Line icons set. Vector
-
 Couple love, Loan percent and Web search icons set. Payment exchange, Graph laptop and Like hand signs. Vector
-
 Stock market and exchange. Candle stick graph chart of stock market investment trading. Stock market data. Bullish point, Trend of graph. Vector illustration
-
 Candle stick graph chart of stock market investment trading, Stock exchange concept design and background. Vector illustrations.
-
 Forex trading graph. Vector financial technology illustration. Investment strategies or online cross platform trading concept. Laptop device with candlestick chart. Stock exchange indicators.
-
 Stock trade chart of abstract asset with moving averages and volume. Rising price. Light theme of exchange trading graph in candlestick chart style. Bullish trend. Vector illustration for forex trade, stockbroker, finance, investment adviser, etc
-
 Stock market and exchange. Business Candle stick graph chart of stock market investment trading. Stock market data. Bullish point, Trend of graph. Vector illustration
-
 Bearish market trend in cryptocurrency or stocks. Trade exchange background, down arrow graph.
-
 Stock exchange board, market index graphs and charts, vector background. Stock exchange board prices on screen display, tickers, financial data numbers and electronic trade rates
-
 Stock market trading technical analysis bar chart fall. Business candlestick graph exchange down trend. Crisis economy and investment loss graph. Trader financial index crash concept. Eps banner
-
 Financial trade concept. Stock market and exchange. Candle stick graph chart.
-
 Forex and Stock Market Graph Illustration, concept of business Investment and future exchange.
-
 Financial Graph Chart
-
 Stock market, economic graph with diagrams, business and financial concepts and reports, abstract technology communication concept vector background
-
 Financial stock market graph on stock market investment trading, Bullish point, Bearish point. trend of graph for business idea and all art work design. vector illustration.
-
 Set of blue-themed financial graphs depicting data trends, including line and area charts. Illustrating business growth and analytics. Concept of economics, financial analytics and growth
-
 Stock market or forex trading graph in graphic concept for financial investment or economic trends business idea design. Worldwide finance background. Vector illustration.
-
 Vector line graph element. Modern simple chart background.
-
 Candlestick graph in stock market of forex trading with graphic design for business or financial concept, vector illustration
-
 Business graph chart and diagram. Financial research and data monitoring. Market analysis and success statistic. Vector illustration
-
 Business graph with arrow vector illustration
-
 Business graph icons set
-
 Stock Market Graph
-
 Piggy bank with bitcoin vector cartoon outline illustration on background of rising bar graph. Money savings concept.
-
 Stocks market trading forex currency exchange
-
 Abstract background with stock graph. Eps10 Vector illustration.
-
 Bar financial data graph. Forex stock crypto currency trading pattern.
-
 Stock Exchange
-
 Abstract background of stock market Investing Insights with magnifying glass and indicator technical analysis graph
-
 Stock market background or forex trading business graph chart for financial investment concept of Martinique map. business idea and technology innovation design.
-
 Technical Analysis Of Exchange Trade, stock market or stock exchange vector illustration
-
 Business candle stick graph chart of stock market investment trading on dark background design. Bullish point, Trend of graph. Vector illustration
-
 Hand holding magnifying glass with candle stick graph chart of s
-
 Candle stick graph chart of stock market investment trading, Bullish point, Bearish point. trend of graph vector design.
-
 Illustration of stock market losses. Bankrupt financial information concept with arrows pointing down. Descending trading graph
-
 World Map with Financial Data Graph Chart on Blue Background.
-
 Stock market investment trading graph in graphic concept suitable for financial investment or Economic trends business idea. Vector illustration design
-
 Vector background with stock market candlesticks chart. Forex trading creative design. Candlestick graph illustration for trade analytics
-
 Abstract futuristic technology background of Chart graph lower low candle stick green and red
-
 Inflation background worldwide due to pandemic. Graph showing increase in inflation ,inflation wording and arrow line chart vector on red background
-
 Candle stick graph, trading chart vector illustration.
-
 Forex trade chart on electronic devices background vector illustration. Financial market candlestick graph webpage banner. Forex trading graphic design concept.
-
 Market finance fall. Financial graph down.
-
 Business candle stick graph chart of stock market investment trading on white background design. Bullish point, Trend of graph. Vector illustration
-
 Candlestick stock exchange background vector. Forex green background with world currencies symbols
-
 World stock market index graph. Perspective view. Candlestick chart, line graph and bar chart. Stock market growth illustration. Financial market background. Blue color. Vector illustration
-
 Stock market or forex trading graph and candlestick chart suitable for financial investment concept. Economy trends background for business idea and abstract finance background. Vector illustration.
-
 Candle stick chart investing illustration. Bullish uptrend. Suitable for stock exchange, forex trading and crypto price analysis.
-
 Barrel of oil price chart vector illustration in flat style. Stock graph on laptop screen.
-
 Candlestick trading graph isolated on png or transparent background, investing stocks market,buy and sell sign candlestick, vector illustration
-
 Business candle stick graph chart of stock market investment trading on blue background. Bullish point, up trend of graph. Economy vector design.
-
 Stock market concept bull vs bear are facing and fighting on brown paper background with downtrend and uptrend graph
-
 Business failure, company bankruptcy, stock market crash and loss trading graph. The concept of economic recession and crisis. Fall of world trade. Negative investment indicator down turn infographics
-
 Bull and bear symbol of stock market with candle stick graph
-
 Abstract background of stock market candle stick on graph chart black background
-
 Vector stock market trading graph cryto currency concept.
-
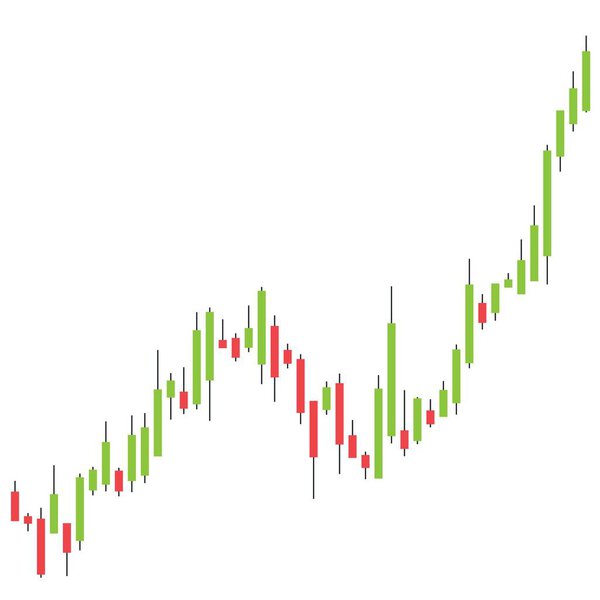 Candlestick graph. Stock market trading chart, also used for currency and crypto markets. Up trend - bullish uptrend. Market going up.
-
 Financial chart with uptrend line graphs and candlesticks. Abstract infographics visualization. Graphic concept for your design
-
 Stock market investment trading graph on blue background. Vector illustration design.
-
 Stock market or forex trading graph. Chart in financial market vector illustration Abstract finance background.
-
 Stock market crash caused by, economic graph with diagrams, business and financial concepts and reports, abstract blue technology communication concept vector background
-
 Graph and arrow red stock marketing fall background. economy finance crisis low investment.
-
 Bitcoin currency going down. Bitcoin on red graph. Bitcoin crashing background with red backdrop and decreasing graphs.
-
 Stock market investment trading illustration concept. Financial bar chart, yield curves, bond data, and upward-sloping graph on a white background. Business candlestick trend graph
-
 Red arrow graph drop arrow down with world map on red background. Money losing. Stock crisis and finance concept.
-
 Business graph with tending. Stock market data display concept. Stock Market Prices. Candle stick stock market tracking graph. Economical stock market graph.
-
 Stock market concept bull vs bear are facing and fighting on white background with downtrend and uptrend graph
-
 Trading of stock Chart red and green Background template. trade Chart of forex, cryptocurrency, stock market and Binary option with Candles and indicators. Exchange buy sell in financial market.
-
 Business investment forex trading chart on blue dark background. trading stock technology and finance. candlestick chart economic concept. digital income and profit graphs. vector illustration.
-
 Investing background. Candlestick charts for stock exchange with dot world map in background. Stock market conceptual background.
-
 World business graph or stock market chart or forex trading graph in graphic concept. Financial investment or business economic trend candlestick graph. Business idea and technology innovation design.
-
 Abstract infographic visualization. Financial chart with uptrend line graphs and candlesticks. Futuristic network or business analytics. Graphic concept for your design.
-
 Business candle stick graph chart of stock market investment trading, Bullish point, Bearish point. trend of graph vector design.
-
 Financial management. make a budget plan or planning about expenses and income. managing finances and revenue sharing. a businessman who analyzes data from a pie chart. illustration concept design
-
 Stock price increases. traders watch stock price movements. a businessman or analyst analyzes data. observe market data patterns and stock transaction volume. illustration concept design
-
 Charts vector set.
-
 An illustration stock quote a figure rising
-
 3d cycle diagram
-
 Business team background with world map
-
 Financial and business abstract background . Stock market investment vector concept.
-
 Financial project and online market investment process
-
 Globe Internet network
-
 Business Finance logo template vector
-
 Forex stock market investment trading concept, Candlestick pattern with bullish and bearish is a style of financial chart.
-
 120 Popular Icons Set For All Purposes Web, Mobile, App Making, Navigation, Print
-
 The collapse of the market due to coronavirus
-
 Business background
-
 Vector of bull and bear symbols of stock market trends. The grow
-
 Stock Market Data - Illustration
-
 Stock Market Listing
-
 Currency Fluctuations
-
 Unhappy stock market investor
-
 Stock trader in stress
-
 Set of finance and money icons
-
 Stock trader looking at the stock market monitors
-
 Abstract background with japanese candles pattern
-
 Digital analytics data visualization, financial schedule, vector dashboard
-
 Business financial blue abstract background with uptrend candle stick pattern of stock market, investment growth success finance business chart
-
 Forex gap vector illustration. Gap between open and close prices of stock market.
-
 HUD UI for business app. Futuristic user interface and Infographic elements. Abstract virtual graphic touch user interface. UI hud infographic interface screen monitor radar set web elements
Each vector opens in a new tab with its details. Premium files are sold by Depositphotos; we may earn a commission if you buy. How this works.