Variable symbol graph vectors
43 variable symbol graph vector illustrations picked from 7.8M royalty-free files, with no more than 3 per artist so you see real variety. Every file is a scalable EPS that opens in Illustrator, CorelDRAW, Affinity Designer and Inkscape, and exports to SVG or PNG at any size.
-
 Gaus chart with different height columns. Normal distribution graph. Bell shaped curve template for statistics or logistic data. Probability theory math function. Vector flat illustration
-
 Gaussian or normal distribution graphs examples. Bell curve templates. Probability theory concept. Layout for statistics or logistic data isolated on white background. Vector illustration
-
 Standard normal distribution, also Gaussian distribution or bell curve. Used in statistics and in natural and social sciences to represent real-valued random variables of unknown distributions. Vector
-
 Bell curve symbol, a simplified diagram for a standard normal distribution, also called Gaussian distribution, used in probability theory and in statistics. Illustration on white background. Vector.
-
 Data analytics icons including mining, machine learning, decision making, database, business intelligent, science, bar, line graph, scatter plot, histogram, pie chart, box, pyramid, average, variability, random sampling, frequency table, cluster
-
 Gauss distribution. Standard normal distribution. Bell curve symbol. Math probability theory. Vector illustration isolated on white background.
-
 Normal or Gaussian distribution graph. Bell shaped curve. Probability theory mathematical function. Statistics or logistic data template isolated on white background. Vector graphic illustration
-
 Multiple variable bars data outline icon in white and black colors. multiple variable bars data flat vector icon from user interface collection for web, mobile apps and ui.
-
 Math formula icon on white background. formula I symbol. math formula sign. flat style.
-
 Multiple variable vertical bars icon in filled, thin line, outline and stroke style. Vector illustration of two colored and black multiple variable vertical bars vector icons designs can be used for
-
 Multiple variable vertical bars outline icon in white and black colors. multiple variable vertical bars flat vector icon from user interface collection for web, mobile apps and ui.
-
 Vector infographic in the form of a luminous variable graph. EPS 10
-
 Infographic template with icons and 8 options or steps. infographic for user interface concept. included multiple variable lines, data analytics bars, table for data, user data analytics, email
-
 Two color multiple variable bars data vector icon from user inte
-
 Compound interest infographic template with formula board calculator showing amount principal rate and time variables flat style vector
-
 Line graph vector icon
-
 Dollar Growth Graph Vector Mesh 2D Model and Triangle Mosaic Icon
-
 Graphs Composition Icon of Round Dots
-
 Graph Monitoring Vector Mesh Wire Frame Model and Triangle Mosaic Icon
-
 Outline multiple variable bars data vector icon. isolated black simple line element illustration from user interface concept. editable vector stroke multiple variable bars data icon on white
-
 Device buttom line icon, concept sign, outline vector illustration, linear symbol.
-
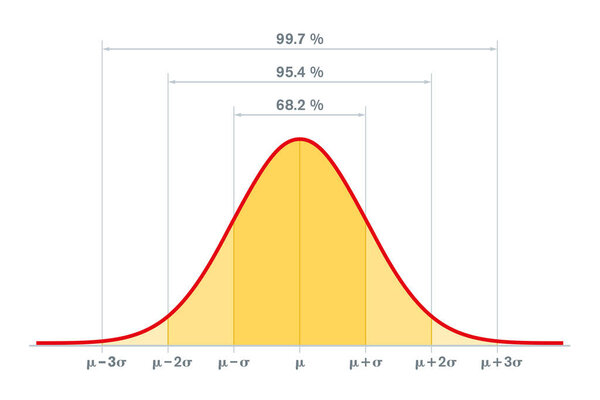 Standard normal distribution, standard deviation and coverage in statistics. Empirical rule, 3-sigma or 689599.7 rule. Gaussian distribution or bell curve, used in statistics. Illustration. Vector.
-
 Data analytics icons including scatter plot, scramble system, secure backup, shared web hosting, software developer, statistics, structure, update, timeline chart, unstructured, user analysis, variability.
-
 Scatter plot shows a perfect degree of positive correlation
-
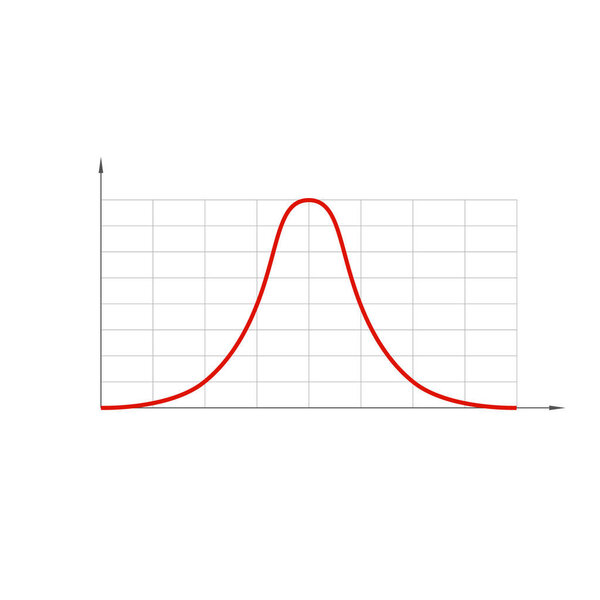 Standard normal distribution, also Gaussian distribution or bell curve.
-
 Mathematics icon set in thin line style
-
 Mathematics icon set illustration graphic design
-
 Degree of correlation. Scatter plot
-
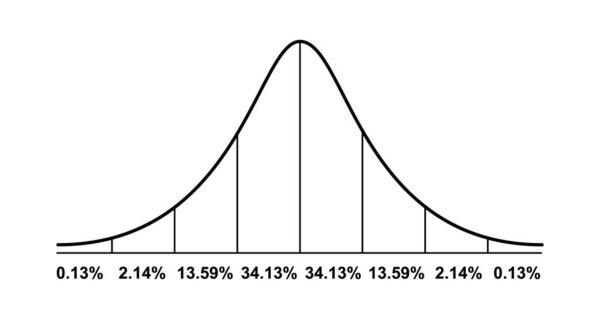 Gauss distribution. Standard normal distribution. Math probability theory. Distribution standard gaussian chart. Vector illustration isolated on white background.
-
 Scatter plot shows a weak degree of positive correlation
-
 Flat function icons
-
 Hand drawn mathematics formulas on chalkboard for background, banner,book cover and etc. for education industry
-
 ALGEBRAIC writing vector design on a yellow background very simple and very cool
-
 Bars and line ascending of data analytics icon in different styl
-
 Vector Trend Chart Mosaic Icon of Triangle Items
-
 Vector Trend Charts Mosaic Icon of Triangles
-
 Variability vector icon Linear icon. Editable stroked line
-
 Vector Rocket Bar Chart Mosaic Icon of Triangles
-
 Vector website design template . CPQ - configure price quote, business concept. illustration for website banner, marketing materials, business presentation, online advertising.
-
 Vector Chart Collage of Dots
-
 Vector Coordinate System Mosaic of Dots
-
 Vector Stock Chart Composition of Small Circles with Scratched Markets Stamp
-
 User ascending icon in outline style. Icon for user management.
Each vector opens in a new tab with its details. Premium files are sold by Depositphotos; we may earn a commission if you buy. How this works.
Related collections
-
 Symbol
-
 Apple symbol
-
 Basketball symbol
-
 Calligraphy alphabet font symbol
-
 Magnifying glass transparent symbol
-
 Halloween pumpkin outline orange symbol
-
 Graffiti letters symbol
-
 Water volleyball symbol
-
 Eastern philosophy symbol meditation
-
Eastern philosophy symbol spiritual
-
 Satanic symbols
-
 Congruent symbol