Variable science math vectors
89 variable science math vector illustrations picked from 6.5M royalty-free files, with no more than 3 per artist so you see real variety. Every file is a scalable EPS that opens in Illustrator, CorelDRAW, Affinity Designer and Inkscape, and exports to SVG or PNG at any size.
-
 Concept Line Icons Set 13 Math
-
 I Love Math
-
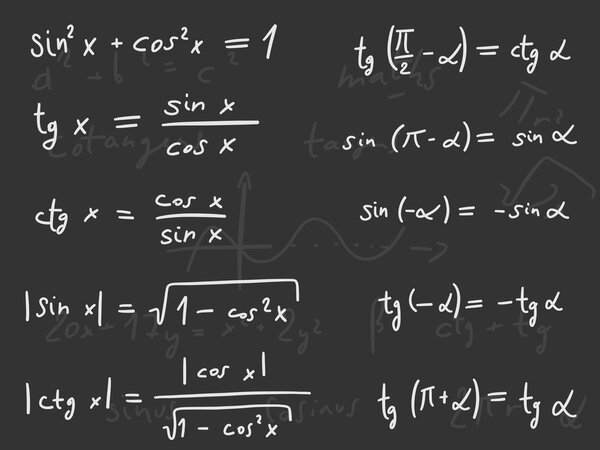 Maths lesson
-
 Standard normal distribution, also Gaussian distribution or bell curve. Used in statistics and in natural and social sciences to represent real-valued random variables of unknown distributions. Vector
-
 Math exponentiation white icons on round color glass buttons
-
 Gauss distribution. Standard normal distribution. Bell curve symbol. Math probability theory. Vector illustration isolated on white background.
-
 Set of scatter plot diagrams. Scattergrams with different types of variables correlation. Data points plotted on a horizontal and a vertical axis on Cartesian plane. Vector flat illustration
-
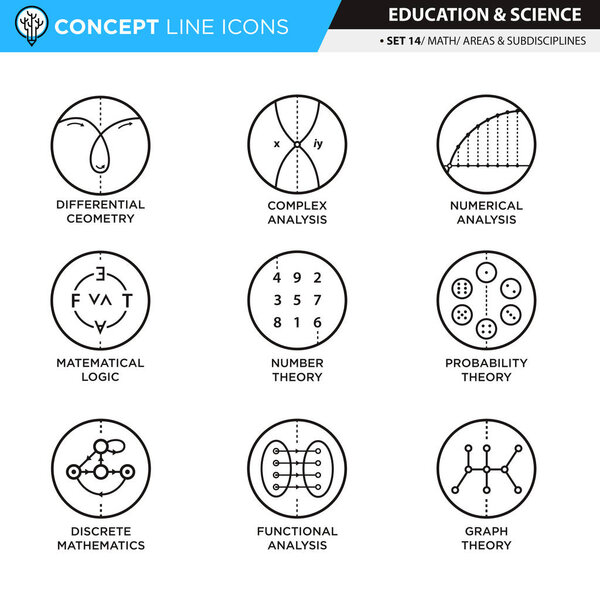 Concept Line Icons Set 14 Math
-
 Set of scatter plot diagrams. Scattergrams with different types of variables negative correlation. Data points plotted on a horizontal and a vertical axis on Cartesian plane. Vector flat illustration
-
 Mathematics banners. Flat vector education concept of math, algebra, calculus. Vertical layout composition.
-
 Math formula icon on white background. formula I symbol. math formula sign. flat style.
-
 Math
-
 Flat design with numbers and pink heart. I love math
-
 The Two Variables of Acceleration Infographic Diagram with example showing more mass result in less acceleration and more force result in more acceleration and speed physics science education vector
-
 Vector illustration. Math function graph icon
-
 Mosaic No calculator icon composed of square items in variable sizes and color hues. Vector square items are grouped into abstract mosaic no calculator icon. Bonus icons are placed.
-
 Equation under the root neon sign. Math lesson Light icon. Vector illustration for design. Algebra concept
-
 Search Math Solution Vector Mesh 2D Model and Triangle Mosaic Icon
-
 Black color analog flip board with word variable on gray background
-
 Bell curve graph, density curve graph. Gauss chart, normal distribution graph. template for statistics or logistic data. Probability theory math function. Vector flat illustration
-
 Mathematics icons in line design. mathematics, math, calculation, formula, equation, geometry, algebra on white background vector. Mathematics editable stroke icons.
-
 Scatter plot correlation diagram line icon representing statistical data distribution analysis research variables mathematical function metric coordinates business reporting chart
-
 Handwritten vector math formula y equals tg x. Trigonometric tangent function equation in black ink on transparent background
-
 Handwritten math calculus integration problem solved step by step in blue ink using square roots, isolated on white background for learning.
-
 Math exponentiation flat white icons in square backgrounds
-
 Scatter Plot Line Icon, Outline Symbol for Data Distribution, Statistical Correlation, Variable Research, Scientific Analysis, and Pattern Visualization. Vector Sign Icon.
-
 Handwritten math formula of a quadratic function on transparent background. Isolated vector parabola equation lettering for educational design
-
 A mathematical equation with variables and exponents in a handwritten style. The equation features letters and numbers artistically arranged. Cartoon vector illustration.
-
 Regression analysis with linear data statistics results outline diagram. Labeled educational scheme and mathematical function calculation with variable outcome forecasting vector illustration.
-
 Handwritten math formula of a cubic function on transparent background. Isolated vector equation lettering for high school algebra design
-
 Handwritten math step-by-step calculus integration solution with red ink using u-substitution, isolated on a clean white background for education.
-
 Handwritten red trigonometric identity formulas on white background, featuring fundamental math equations for education, study, science, and algebra.
-
 Black color in word variable on slot banner with yellow color background
-
 Alphabet letter in word variable on crossword puzzle background
-
 Variable symbol icon Flat thin line vector illustration art outline set
-
 Handwritten mathematical formulas including algebra, exponents, and Pythagorean theorem. Educational scientific background. Chalk, crayon or marker style sketch of math formulas.
-
 A mathematical equation with a square root symbol in a hand-drawn style. The equation features variables and a radical sign in a sketchy appearance. Cartoon vector illustration.
-
 Math exponentiation flat icons on color rounded square backgrounds
-
 Minimalist Icon of a Calculator Representing Education and Science Concepts in a Contemporary Digital Environment
-
 Correlation analysis or bivariate statistics calculation outline hands concept. Mathematical market research technique and method finding out whether a relationship exists between variables.
-
 Exact science set icon. Planet, magnet, battery, graph, formula, calendar, ruler, magnifier, equation, atom, gear, experiment, physics, research, data, calculation.
-
 Regression analysis as statistical data interpretation outline hands concept. Find variable outcome from analytical chart with results vector illustration. Linear graph with forecasting presentation
-
 A stylized square root symbol with a variable in a clean line art style. The illustration depicts a mathematical expression in a modern, simplified form. Cartoon vector illustration.
-
 Hand drawn mathematics formulas on chalkboard for background, banner,book cover and etc. for education industry
-
 Mathematical seamless pattern
-
 Gaussian or normal distribution graphs examples. Bell curve templates. Probability theory concept. Layout for statistics or logistic data isolated on white background. Vector illustration
-
 Standard normal distribution, with the percentages for three standard deviations of the mean. Sometimes informally called bell curve. Used in probability theory and in statistics. Illustration. Vector
-
 Gaussian distribution. Standard normal distribution, sometimes informally called a bell curve, used in probability theory and statistics. Standard deviation. Illustration on white background. Vector.
-
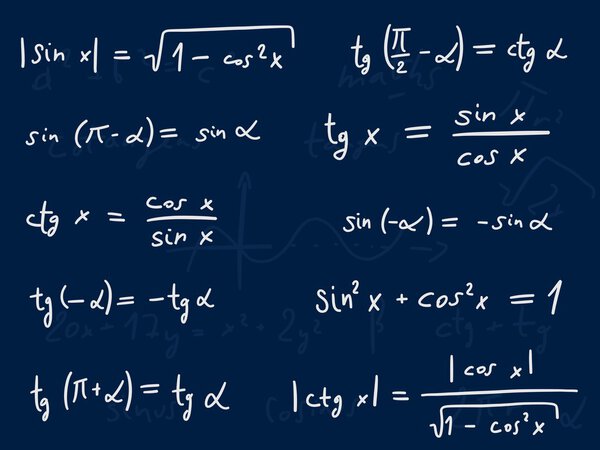 Trigonometric functions
-
 Trigonometry
-
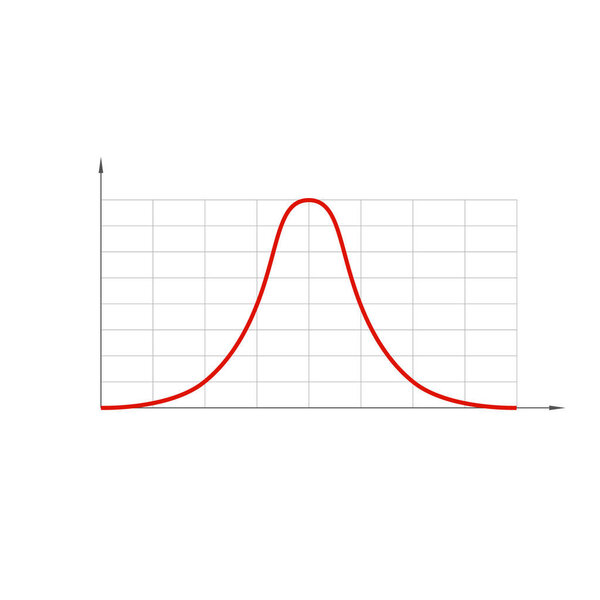 Standard normal distribution, also Gaussian distribution or bell curve.
-
 Physics line equations
-
 Black Trigonometric circle icon isolated on white background. Set icons colorful. Vector.
-
 Logotype line Trigonometric circle icon isolated on grey background. Logo design template element. Vector
-
 Psi greek sign
-
 Derivatives of exponential and logarithmic functions
-
 ALGEBRAIC writing vector design on a yellow background very simple and very cool
-
 Mathematic icon isolated on background
-
 White line Trigonometric circle icon isolated seamless pattern on red background. Vector
-
 Dotted Parabola Plot Mosaic Icon of Spheric Items
-
 Kurva icon illustration logo design
-
 Mathematics Integral Icon or Symbol Design
-
 Mathematical intergal symbol icon vector template illustration logo design
-
 Minimalist Outline Scatter Plot Graph with Regression Curve Line and Data Points Icon Symbol
-
 Statistical Chart Icons, Color Outline Style
-
 Mathematical subscript and superscript notation icons in four distinct typographic styles for academic with circular badge styles digital interfaces outline bold regular
-
 Mathematical Function Fx Symbol Vector Illustration on White Background
-
 Statistical Chart Icons, Dual Style Icon Set
-
 Quadratic equation formula written in black ink. illustration of mathematical formulas in algebra material and quadratic equation sub material. perfect square forms
-
 Data analysis black line icon for digital and print projects. Minimal clean icons for apps and websites. Modern simple icons for UI UX and branding
-
 Mathematical equation representing Simple Harmonic Motion
-
 Outline L Shape Axis with Scattered Data Points Icon
-
 Showing formula for calculating speed using distance and time
-
 Black Lambda Symbol Inside Parentheses Graphic Icon
-
 Trigonometric Sin Cos Tan Function Graph Diagram. goniometric mathematical function sine, cosine, tangent graph wave vector illustration.
-
 Isometric line Trigonometric circle icon isolated on green, blue and pink background. Square button. Vector
-
 Chain rule for composite functions
-
 Glowing neon line Trigonometric circle icon isolated on black background. Vector
-
 Mathematical formula displayed on a blue board with long shadow.
-
 Data analysis color flat icon for digital and print projects. Minimal clean icons for apps and websites. Modern simple icons for UI UX and branding
-
 Algebraic identities expression formula doodle handwriting collection set vector illustration. Scientific education square formulas. Mathematics resources for teacher and student background
-
 Algebra concept icon. Algebraic equations, more and less sign. Advanced calculations, learning advanced algebra idea thin line illustration. Vector isolated outline drawing. Editable stroke
-
 Mathematician woman concept. Young girl with number in hands sitting on book next to textbook, large pencil and ruler. Student solves equation, does homework. Cartoon flat vector illustration
-
 Algebra neon light concept icon. Advanced calculations, learning
-
 This image presents a comprehensive collection of mathematical, scientific, and logical symbols arranged in a grid format against a white background. The symbols include fundamental arithmetic operators such as addition, subtraction, multiplication,
-
 A white icon of a trash can with mathematical equations on it against a black background.
-
 Bayes Theorem Probability Theory statistics vector illustration infographic
-
 Hand Drawn Bell Curve Icon Set. Sketch collection representing probability distribution theory and statistical analysis concepts for mathematical research visualization.
-
 Vector Cartesian Axes Mosaic Icon of Triangle Elements
Each vector opens in a new tab with its details. Premium files are sold by Depositphotos; we may earn a commission if you buy. How this works.