Variable science diagram vectors
98 variable science diagram vector illustrations picked from 301 royalty-free files, with no more than 3 per artist so you see real variety. Every file is a scalable EPS that opens in Illustrator, CorelDRAW, Affinity Designer and Inkscape, and exports to SVG or PNG at any size.
-
 The Two Variables of Pressure Infographic Diagram unit area example is man standing and laying on mattress force example is placing one and two brick on the sponge physics science education vector
-
 The Two Variables of Acceleration Infographic Diagram with example showing more mass result in less acceleration and more force result in more acceleration and speed physics science education vector
-
 Types of Pressure Infographic Diagram including atmospheric absolute zero gauge vacuum differential variable points absolute pressure formula atmosphere air pressure physics science education vector
-
 Vector statistical icons of correlation types. Positive, negative, no correlation. The relationship between two data sets or two random variables. Graphs or charts.
-
 Data analytics icons including mining, machine learning, decision making, database, business intelligent, science, bar, line graph, scatter plot, histogram, pie chart, box, pyramid, average, variability, random sampling, frequency table, cluster
-
 Hypothesis testing and scientific experiment research outline diagram. Labeled educational scheme with alternative accepted and null not rejected hypothesis vector illustration. Opinion proof method.
-
 Correlation is a statistical measure that expresses the extent to which two variables are linearly related
-
 Set of scatter plot diagrams. Scattergrams with different types of variables negative correlation. Data points plotted on a horizontal and a vertical axis on Cartesian plane. Vector flat illustration
-
 Set of scatter plot diagrams. Scattergrams with different types of variables correlation. Data points plotted on a horizontal and a vertical axis on Cartesian plane. Vector flat illustration
-
 Antibody structure diagram for education illustration
-
 Standard normal distribution, also Gaussian distribution or bell curve. Used in statistics and in natural and social sciences to represent real-valued random variables of unknown distributions. Vector
-
 Variable resistor, vector best gray line symbol on white background, EPS 10
-
 Set of electronic circuit symbols. Schematic circuit diagrams vector illustration
-
 Bell curve symbol, a simplified diagram for a standard normal distribution, also called Gaussian distribution, used in probability theory and in statistics. Illustration on white background. Vector.
-
 Bell curve graph. Normal or Gaussian distribution template. Probability theory mathematical function. Statistics or logistic data diagram isolated on white background. Vector graphic illustration
-
 Antibodies Affinity Reagents, labeled diagram, educational immunology poster design, IgG, Fab fragment, scFv, nanobody, antibody fragments, antigen binding, recombinant protein illustration
-
 Machine icons set with analysis design, computer cooler, gear algorithm and other variable architecture elements. Isolated vector illustration machine icons.
-
 Pentameric IgM immunoglobulin antibody structure schematic illustration. Simple immunology diagram.
-
 BJT Common Emitter Characteristic Curve Measurement Circuit Diagram
-
 Scatter plot correlation diagram line icon representing statistical data distribution analysis research variables mathematical function metric coordinates business reporting chart
-
 Mathematical diagram illustrating the intermediate value theorem with a red continuous function curve, dotted line, and blue intersection points.
-
 Scatter Plot Line Icon, Outline Symbol for Data Distribution, Statistical Correlation, Variable Research, Scientific Analysis, and Pattern Visualization. Vector Sign Icon.
-
 Regression analysis with linear data statistics results outline diagram. Labeled educational scheme and mathematical function calculation with variable outcome forecasting vector illustration.
-
 3D Isometric Flat Vector Illustration of ERG Theory, Pyramid Diagram, Visual Representation Of Motivation
-
 IgG4 immunoglobulin antibody structure schematic illustration. Simple immunology diagram.
-
 A minimalist icon representing a scatter plot graph with numerous dots distributed in a pattern that suggests a positive correlation between two variables.
-
 Outline Line Style Scatter Plot Chart Coordinate Axis Diagram Statistics Analytics Icon
-
 Electronic circuit symbols. Basic electronic elements, schematic switch, ammeter and battery, capacitor and resistor, thermistor and transistor of variable current. Manual worksheet vector icons.
-
 A black electrical symbol for a variable capacitor with an arrow on a white background.
-
 Types of Variables in Scientific Experiment Diagram
-
 Trigonometric Sin Cos Tan Function Graph Diagram. goniometric mathematical function sine, cosine, tangent graph wave vector illustration.
-
 Schematic designation of a resistor and rheostat with variable resistance - used in electrical engineering
-
 IgD immunoglobulin antibody structure schematic illustration. Simple immunology diagram.
-
 Line Simple Coordinate System Graph Diagram Chart Icon Symbol
-
 Positive and negative correlation graph. Geometric diagram with mathematical variable and information scatter functions with vector calculations
-
 Variable capacitor Icon, Vector sign.
-
 Correlation analysis or bivariate statistics calculation outline hands concept. Mathematical market research technique and method finding out whether a relationship exists between variables.
-
 Ideal gas law equation with labeled variables pressure volume amount temperature ideal gas constant for educational material use
-
 Mathematical function graphs and coordinate systems displayed on a clean web banner. Education, algebra, geometry, calculus, science, research. Plotting curves and axes on a Cartesian plane
-
 Technical aerospace CAD engineering blueprint of a supersonic ramjet variable geometry inlet translating centerbody spike actuator and oblique shock wave system
-
 Capacitors types infographics diagram, types such as Paper,Polystyrene,Bipolar,Electrolytic,Polycarbonate,Polyester,Mylar,Silver mica,Ceramic,Tantalum electrolyte,Feed through,Trimmer,Variable. EPS10.
-
 Variable capacitor diagram and text information pattern on glass banner,vector illustration design,eps10.
-
 Circuit diagram on dark background
-
 Electrical Line Diagram
-
 Concept Line Icons Set 13 Math
-
 Standard normal distribution, with the percentages for three standard deviations of the mean. Sometimes informally called bell curve. Used in probability theory and in statistics. Illustration. Vector
-
 Hand drawn mathematics formulas on chalkboard for background, banner,book cover and etc. for education industry
-
 Gauss distribution. Standard normal distribution. Bell curve symbol. Math probability theory. Vector illustration isolated on white background.
-
 Electrical circuit symbols
-
 Elements of electrical circuits.
-
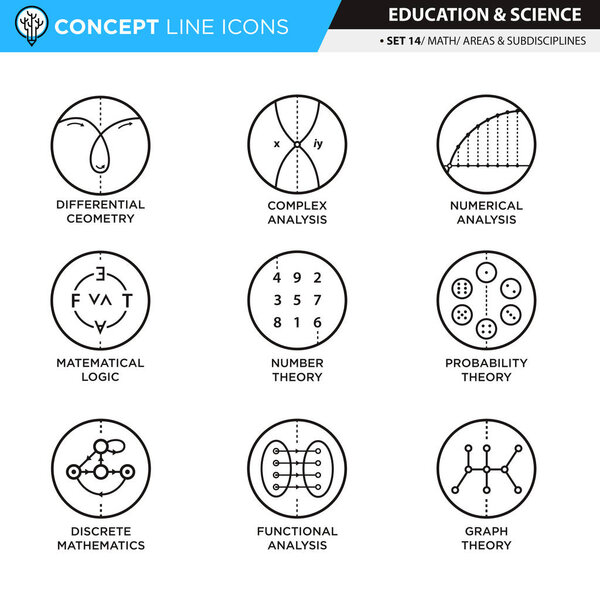 Concept Line Icons Set 14 Math
-
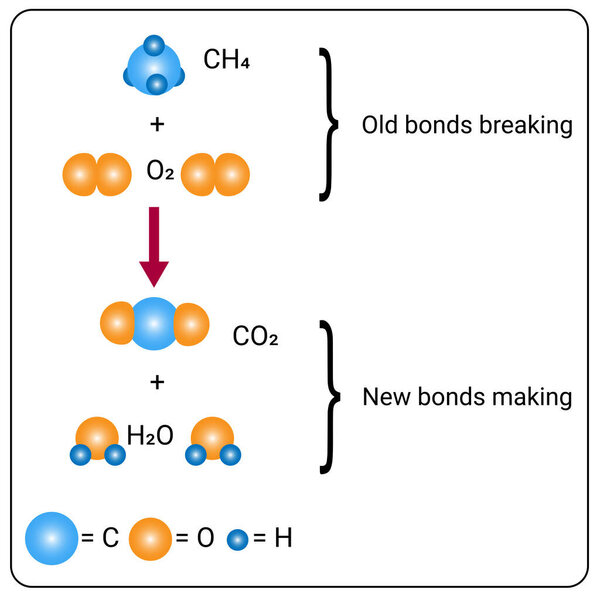 Chemical reactions occur and the elements contained in a chemical substance
-
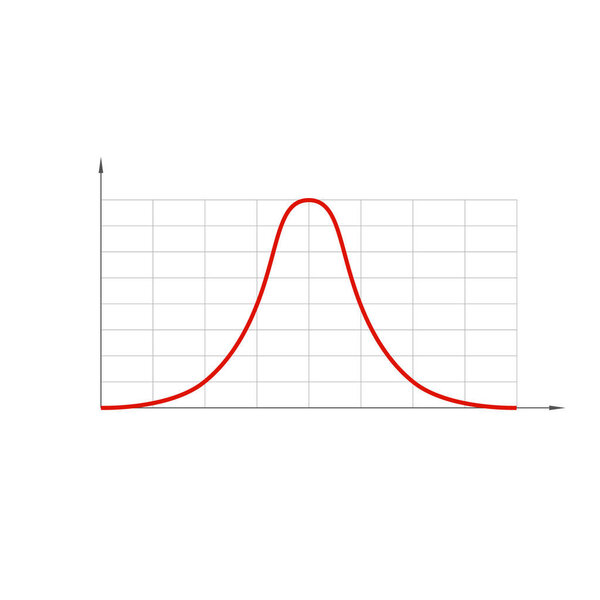 Standard normal distribution, also Gaussian distribution or bell curve.
-
 Degree of correlation. Scatter plot
-
 The structure of the antibody (immunoglobulin). Antibody binds to a specific antigen
-
 Flow chart computer symbol
-
 Electric circuit elements. resistors
-
 Circulation of Atmosphere
-
 Scatter plot shows a weak degree of positive correlation
-
 Flat function icons
-
 Scatter plot shows a perfect degree of positive correlation
-
 DNA Spiral Vector Mesh Network Model and Triangle Mosaic Icon
-
 Function color buttons. Colored icons web tools for your interface
-
 Functions Plot Mosaic Icon of Circle Dots
-
 Sine plot Composition Icon of Tuberous Items
-
 Glowing neon line Electrolytic capacitor icon isolated on black background. Colorful outline concept. Vector.
-
 Different types of inductor symbol. electronic circuit symbol
-
 Device buttom line icon, concept sign, outline vector illustration, linear symbol.
-
 Kurva icon illustration logo design
-
 Scatter plot icon. Thin, Light Regular And Bold style design isolated on white background
-
 Bell curve graph, density curve graph. Gauss chart, normal distribution graph. template for statistics or logistic data. Probability theory math function. Vector flat illustration
-
 Logotype line Electrolytic capacitor icon isolated on white background. Logo design template element. Vector.
-
 Line Electrolytic capacitor icon isolated seamless pattern on red background. Vector
-
 Mathematics icons in line design. mathematics, math, calculation, formula, equation, geometry, algebra on white background vector. Mathematics editable stroke icons.
-
 Minimalist vector illustration of absolute value function graph y equals x with yellow V-shaped line on coordinate axes over white background
-
 Fuse Engineering Symbol, Vector symbol design. Engineering Symbols.
-
 Types of correlation. Strong, weak, and perfect positive correlation, strong, weak, and perfect negative correlation, no correlation. Scatter plot.
-
 Colorful box plot chart visualizing data distribution, highlighting quartiles, median, and potential outliers, offering insights into statistical trends across categories sf, hg, and bn
-
 Handwritten physical formula showing the relation between linear velocity, radius, and angular velocity, drawn in black ink on a clean white background for educational design.
-
 Mathematics integral symbol icon illustration design
-
 Function flat white icons on round color backgrounds. 6 bonus icons included.
-
 Electric Circuit Voltmeter flat vector icon. Simple solid symbol isolated on white background
-
 Symbolic minimalist illustration. Thermometer icon with up and down arrows, suggesting temperature fluctuations. Useful for weather, healthcare, or datadriven design projects.
-
 Handwritten physical equation displaying tangential acceleration equal to radius multiplied by angular acceleration, drawn in black marker on a plain white background.
-
 Green algebraic graph background featuring a fine square coordinate grid and several thin white curved lines intersecting across the mathematical plane. The geometric composition suggests functions, coordinate geometry, calculus, equations, and mathe
-
 Pink algebraic graph background featuring a fine square coordinate grid and thin white curved lines forming a smooth mathematical arc with layered geometric details. The composition combines graph paper structure with an elegant mathematical function
-
 Function flat color icons in round outlines. 6 bonus icons included.
-
 Green algebraic graph background featuring a fine square coordinate grid and a thin white upward-opening parabolic curve centered on the mathematical plane. The clean technical composition represents algebra, functions, equations, coordinates, calcul
-
 Bayes Theorem Probability Theory statistics vector illustration infographic
-
 A graphic representation of a piecewise linear function with saturation on an orange circular background.
-
 A stylized illustration of a bell curve graph with vertical bars representing data distribution.
-
 Resistor IEC System Symbol, Vector symbol design. Engineering Symbols.
-
 Attenuator Engineering Symbol, Vector symbol design. Engineering Symbols.
-
 Hand Drawn Bell Curve Icon Set. Sketch collection representing probability distribution theory and statistical analysis concepts for mathematical research visualization.
-
 Vector Cartesian Axes Mosaic Icon of Triangle Elements
-
 Avogadro's law equation, volume and the amount of gas at constant temperature and pressure, hand-drawn illustration doodle, math and chemistry formulas
-
 Molecules and atoms isolated on a white background with their name. Vector illustration
-
 Electric Circuit Voltmeter Flat Vector Icon
Each vector opens in a new tab with its details. Premium files are sold by Depositphotos; we may earn a commission if you buy. How this works.