Variable science analysis vectors
74 variable science analysis vector illustrations picked from 9.1M royalty-free files, with no more than 3 per artist so you see real variety. Every file is a scalable EPS that opens in Illustrator, CorelDRAW, Affinity Designer and Inkscape, and exports to SVG or PNG at any size.
-
 Vector statistical icons of correlation types. Positive, negative, no correlation. The relationship between two data sets or two random variables. Graphs or charts.
-
 Two scientists, a woman and a man, are studying complex mathematical formulas written on a blackboard, engaging in scientific discussion and analysis
-
 Data analytics icons including mining, machine learning, decision making, database, business intelligent, science, bar, line graph, scatter plot, histogram, pie chart, box, pyramid, average, variability, random sampling, frequency table, cluster
-
 Correlation is a statistical measure that expresses the extent to which two variables are linearly related
-
 Set of scatter plot diagrams. Scattergrams with different types of variables negative correlation. Data points plotted on a horizontal and a vertical axis on Cartesian plane. Vector flat illustration
-
 Set of scatter plot diagrams. Scattergrams with different types of variables correlation. Data points plotted on a horizontal and a vertical axis on Cartesian plane. Vector flat illustration
-
 Standard normal distribution, also Gaussian distribution or bell curve. Used in statistics and in natural and social sciences to represent real-valued random variables of unknown distributions. Vector
-
 Covid Analysis Flask Mosaic of Circle Pixels
-
 Analysis Vial Mosaic of Covid Virus Icons
-
 Mosaic Chemical desk icon organized from square items in variable sizes and color hues. Vector square elements are organized into abstract collage chemical desk icon. Bonus icons are added.
-
 Machine icons set with analysis design, computer cooler, gear algorithm and other variable architecture elements. Isolated vector illustration machine icons.
-
 Black color analog flip board with word variable on gray background
-
 Scatter plot distribution graph icon with colorful variable points and dots for statistical correlation analysis and research scientific data evaluation
-
 Scatter plot correlation diagram line icon representing statistical data distribution analysis research variables mathematical function metric coordinates business reporting chart
-
 Scatter Plot Line Icon, Outline Symbol for Data Distribution, Statistical Correlation, Variable Research, Scientific Analysis, and Pattern Visualization. Vector Sign Icon.
-
 Regression analysis with linear data statistics results outline diagram. Labeled educational scheme and mathematical function calculation with variable outcome forecasting vector illustration.
-
 Data analysis black line icon for digital and print projects. Minimal clean icons for apps and websites. Modern simple icons for UI UX and branding
-
 A minimalist icon representing a scatter plot graph with numerous dots distributed in a pattern that suggests a positive correlation between two variables.
-
 Black color in word variable on slot banner with yellow color background
-
 Regression analysis point A icon set collection, statistical data evaluation flat signs, mathematics variables graphic styles
-
 Pie chart showcasing data distribution paired with a bell curve for demographic and percentage insights. Ideal for analytics, statistics, business reports, marketing trends, research, data science
-
 Alphabet letter in word variable on crossword puzzle background
-
 Handwritten mathematical formula for quartile deviation calculation vector illustration isolated on plain white background symbol for algebra learning science research and educatio
-
 Data analysis color flat icon for digital and print projects. Minimal clean icons for apps and websites. Modern simple icons for UI UX and branding
-
 Handwritten statistical equation for coefficient of determination calculation vector illustration isolated on white background symbol for algebra study research and data analysis
-
 Positive and negative correlation graph. Geometric diagram with mathematical variable and information scatter functions with vector calculations
-
 Handwritten mathematical equation for mode statistical calculation vector illustration isolated on plain white background symbol for algebra learning science research and education
-
 Set of mathematical graphs and cloud computing icons displayed on a white landing page banner. Data analysis, business growth, cloud storage, statistics, mathematics, digital technology. Vector
-
 Purple algebraic graph background featuring a fine square coordinate grid and a thin white S-shaped flowing curve across the mathematical plane. The composition represents mathematical functions, algebra, graphing, calculus, coordinate analysis, and
-
 Data line vector icons and signs. Mining, Science, Records, Processing, Storage, Management, Visualization, Analysis vector outline illustration set
-
 Minimalist Black Outline Scatter Plot Graph Chart Data Analysis Symbol Icon Graphic
-
 Line Simple Scatter Plot Minimalist Style Data Analysis Icon
-
 Minimalist Icon of a Calculator Representing Education and Science Concepts in a Contemporary Digital Environment
-
 Correlation analysis or bivariate statistics calculation outline hands concept. Mathematical market research technique and method finding out whether a relationship exists between variables.
-
 Orange algebraic graph background featuring a fine square coordinate grid and a thin white flowing curve crossing the mathematical plane. The composition evokes algebra, functions, equations, coordinate geometry, calculus, and mathematical analysis,
-
 Hand Drawn Bell Curve Icon Set. Sketch collection representing probability distribution theory and statistical analysis concepts for mathematical research visualization.
-
 Exact science set icon. Planet, magnet, battery, graph, formula, calendar, ruler, magnifier, equation, atom, gear, experiment, physics, research, data, calculation.
-
 Regression analysis as statistical data interpretation outline hands concept. Find variable outcome from analytical chart with results vector illustration. Linear graph with forecasting presentation
-
 Ideal gas law equation with labeled variables pressure volume amount temperature ideal gas constant for educational material use
-
 Mathematical function graphs and coordinate systems displayed on a clean web banner. Education, algebra, geometry, calculus, science, research. Plotting curves and axes on a Cartesian plane
-
 Security Assessment System for Big Data Servers
-
 Three beakers showing increasing water levels
-
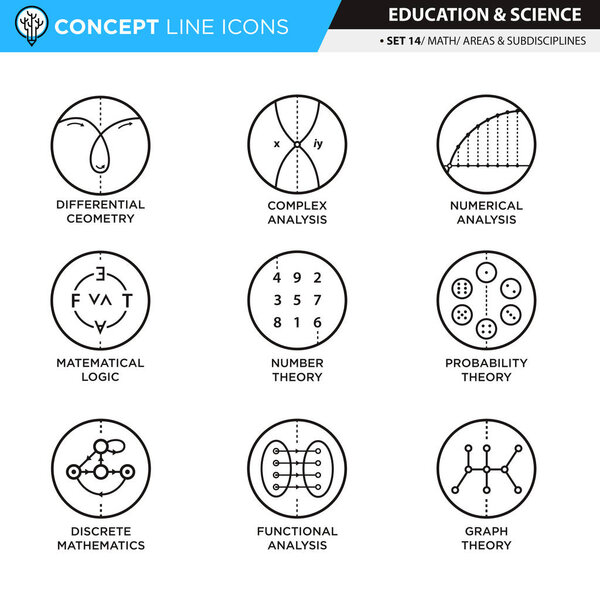 Concept Line Icons Set 14 Math
-
 Mathematics banners. Flat vector education concept of math, algebra, calculus. Vertical layout composition.
-
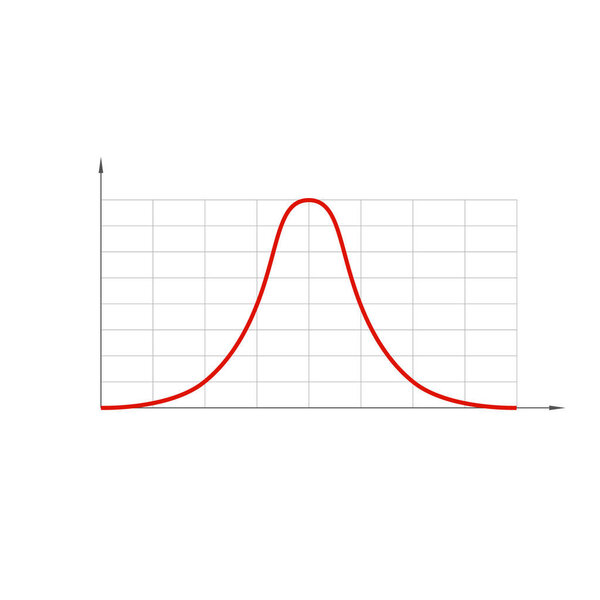 Standard normal distribution, also Gaussian distribution or bell curve.
-
 The structure of the antibody (immunoglobulin). Antibody binds to a specific antigen
-
 Degree of correlation. Scatter plot
-
 Structure Immunoglobulin Molecule.
-
 Math formula icon on white background. formula I symbol. math formula sign. flat style.
-
 Scatter plot shows a perfect degree of positive correlation
-
 Scatter plot shows a weak degree of positive correlation
-
 Correlation is not causation. Lettering. Can be used for prints bags, t-shirts, posters, cards. Calligraphy vector. Ink illustration
-
 Kurva icon illustration logo design
-
 Mathematics Integral Icon or Symbol Design
-
 Scatter plot icon. Thin, Light Regular And Bold style design isolated on white background
-
 Analytics of data mining process linear pixel perfect icon. Development graph. Thin line customizable illustration. Contour symbol. Vector isolated outline drawing. Editable stroke. Arial font used
-
 Mathematical intergal symbol icon vector template illustration logo design
-
 Mathematics icons in line design. mathematics, math, calculation, formula, equation, geometry, algebra on white background vector. Mathematics editable stroke icons.
-
 Artfully designed 24 Bold Line PIXEL perfect vector icons for Experiment, delivered in 128x128 format for consistent visual excellence.
-
 Analytics of data mining process black glyph icon. Development graph. Virtual information statistics. Collect and analyze digital data. Silhouette symbol on white space. Vector isolated illustration
-
 Data set analytics RGB color pixel perfect icon. Information structure researching. Data mining statistics. Isolated vector illustration. Simple filled line drawing. Editable stroke. Arial font used
-
 Mathematical Function Fx Symbol Vector Illustration on White Background
-
 Fx symbol in gradient color on white background.
-
 Types of correlation. Strong, weak, and perfect positive correlation, strong, weak, and perfect negative correlation, no correlation. Scatter plot.
-
 Pink plaque with mathematical formula A equals negative dN over dt.
-
 Colorful box plot chart visualizing data distribution, highlighting quartiles, median, and potential outliers, offering insights into statistical trends across categories sf, hg, and bn
-
 Showing formula for calculating speed using distance and time
-
 Professional-grade collection of 30 Flat vector icons representing Experiment, crafted with 128x128 PIXEL perfect precision for enterprise applications.
-
 Handwritten mathematical formulas including algebra, exponents, and Pythagorean theorem. Educational scientific background. Chalk, crayon or marker style sketch of math formulas.
-
 Green algebraic graph background featuring a fine square coordinate grid and several thin white curved lines intersecting across the mathematical plane. The geometric composition suggests functions, coordinate geometry, calculus, equations, and mathe
-
 Abstract symbol with sigma character inside circle on blue background.
-
 Mathematician woman concept. Young girl with number in hands sitting on book next to textbook, large pencil and ruler. Student solves equation, does homework. Cartoon flat vector illustration
-
 Collection of 10 icons in Thin Line style based on the Experiment theme. Ideal for digital and creative uses.
-
 Laboratory power supply. Vector graphics. Vector illustration
Each vector opens in a new tab with its details. Premium files are sold by Depositphotos; we may earn a commission if you buy. How this works.
