Variable diagram vectors
81 variable diagram vector illustrations picked from 16.7M royalty-free files, with no more than 3 per artist so you see real variety. Every file is a scalable EPS that opens in Illustrator, CorelDRAW, Affinity Designer and Inkscape, and exports to SVG or PNG at any size.
-
 Set of scatter plot diagrams. Scattergrams with different types of variables negative correlation. Data points plotted on a horizontal and a vertical axis on Cartesian plane. Vector flat illustration
-
 Set of scatter plot diagrams. Scattergrams with different types of variables correlation. Data points plotted on a horizontal and a vertical axis on Cartesian plane. Vector flat illustration
-
 The Two Variables of Pressure Infographic Diagram unit area example is man standing and laying on mattress force example is placing one and two brick on the sponge physics science education vector
-
 The Two Variables of Acceleration Infographic Diagram with example showing more mass result in less acceleration and more force result in more acceleration and speed physics science education vector
-
 Hook model of behavioral design strategy framework infographic diagram banner template with icon vector has trigger, action, variable reward and investment cycles. Habit-forming product. Presentation.
-
 Antibody structure and function, Y shaped immunoglobulin binds antigens to neutralize and agglutinate pathogens, key parts include heavy-light chains and variable regions. Outline diagram
-
 Mosaic Euro financial diagram icon constructed from square elements in variable sizes and color hues. Vector square items are grouped into abstract mosaic Euro financial diagram icon.
-
 Concept of variable declaration in programming language outline diagram. Labeled educational coding process explanation with changing values or depending on program conditions vector illustration.
-
 Break even point, profit, loss from revenue compare with fixed cost and variable cost
-
 Vector statistical icons of correlation types. Positive, negative, no correlation. The relationship between two data sets or two random variables. Graphs or charts.
-
 Correlation is a statistical measure that expresses the extent to which two variables are linearly related
-
 Object oriented programming or OOP paradigm explanation outline diagram
-
 Api people diagram sign concept illustration
-
 Standard normal distribution, also Gaussian distribution or bell curve. Used in statistics and in natural and social sciences to represent real-valued random variables of unknown distributions. Vector
-
 Variable resistor, vector best gray line symbol on white background, EPS 10
-
 Variable resistor symbol rheostat vector
-
 Antibody structure diagram on white background illustration
-
 Bell curve symbol, a simplified diagram for a standard normal distribution, also called Gaussian distribution, used in probability theory and in statistics. Illustration on white background. Vector.
-
 Set of electronic circuit symbols. Schematic circuit diagrams vector illustration
-
 Antibody structure diagram for education illustration
-
 Bell curve graph. Normal or Gaussian distribution template. Probability theory mathematical function. Statistics or logistic data diagram isolated on white background. Vector graphic illustration
-
 Icons of capacitors and inductors for electronic circuit diagrams and engineering designs.
-
 Break-even analysis infographic template with sales units line chart card diagram, flat style vector
-
 Break-even point infographic template with formula key element line chart diagram, flat style vector
-
 User interface infographic design template with pie chart circular interface, data coding, data analytics circular, data analytics dual bars, vertical bars, multiple variable points line chart,
-
 User interface infographic design template with box plot chart interface, pie chart analysis interface, dual bars multiple variable vertical bars, data analytics dual bars, emot, spotted data,
-
 Break-even analysis infographic template with cost revenue profit line chart diagram, flat style vector
-
 User interface infographic design template with simple chart interface, multiple variable point line, data analytics, data connected circular interface, data analytics cylinder, box plot chart
-
 Vector infographic in the form of a luminous variable graph. EPS 10
-
 Mosaic Acquisition growth icon composed of square elements in variable sizes and color hues. Vector square parts are composed into abstract mosaic acquisition growth icon. Bonus pictograms are placed.
-
 Coins diagram Composition Icon of Spheric Items
-
 Machine icons set with analysis design, computer cooler, gear algorithm and other variable architecture elements. Isolated vector illustration machine icons.
-
 Variable transverse wave graph performance analysis curve
-
 Data analytics icons including mining, machine learning, decision making, database, business intelligent, science, bar, line graph, scatter plot, histogram, pie chart, box, pyramid, average, variability, random sampling, frequency table, cluster
-
 Data analytics icons including scatter plot, scramble system, secure backup, shared web hosting, software developer, statistics, structure, update, timeline chart, unstructured, user analysis, variability.
-
 Infographic Elements.
-
 Break even point or BEP or Cost volume profit graph of the sales units and the revenue sales
-
 Standard normal distribution, with the percentages for three standard deviations of the mean. Sometimes informally called bell curve. Used in probability theory and in statistics. Illustration. Vector
-
 Concept Line Icons Set 13 Math
-
 Gauss distribution. Standard normal distribution. Bell curve symbol. Math probability theory. Vector illustration isolated on white background.
-
 Complex Numbers in Polar Form Template vector graphic
-
 India infographic with 3D bar and pie chart, increasing values, India country flag on 3D bar graph, ups and downs data, presentation graphic idea, developing country
-
 Timeline template
-
 Ireland 3D bar chart graph with ups and downs, increasing values, Ireland country flag on 3D bar graph, upward rising arrow on data, news banner idea, developing country concept
-
 Electrical circuit symbols
-
 Presentation Template
-
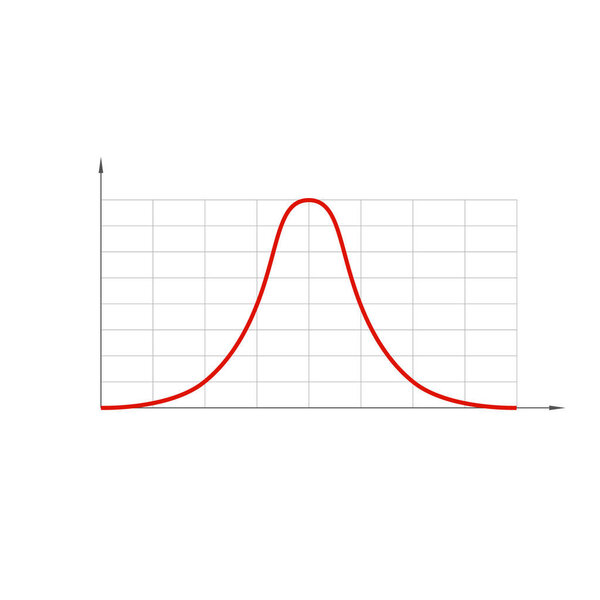 Standard normal distribution, also Gaussian distribution or bell curve.
-
 Flow chart computer symbol
-
 Degree of correlation. Scatter plot
-
 Elements of electrical circuits.
-
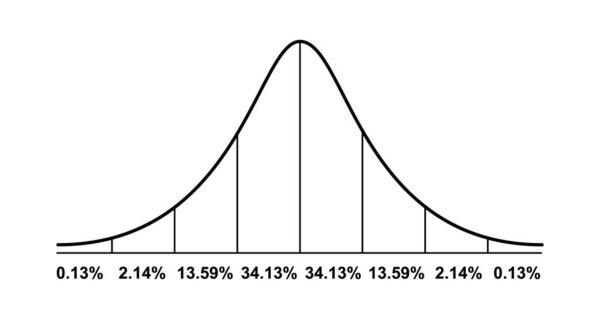 Gauss distribution. Standard normal distribution. Math probability theory. Distribution standard gaussian chart. Vector illustration isolated on white background.
-
 Electric circuit elements. resistors
-
 Bangladesh 3D bar chart graph with ups and downs, increasing values, Bangladesh country flag on 3D bar graph, upward rising arrow on data, news banner idea, developing country concept
-
 Scatter plot shows a weak degree of positive correlation
-
 Concept Line Icons Set 14 Math
-
 Flat function icons
-
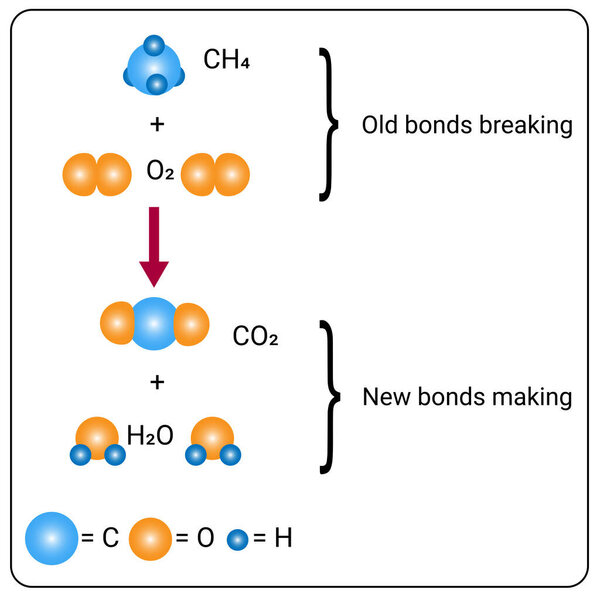 Chemical reactions occur and the elements contained in a chemical substance
-
 The structure of the antibody (immunoglobulin). Antibody binds to a specific antigen
-
 Circulation of Atmosphere
-
 Vector schematic diagramof an electrical circuit with transformer, lamp, alternating voltage source. Physical properties of conductors. The flow charged electrons.
-
 Electronic symbols - vector
-
 Bars and line ascending of data analytics outline icon in white and black colors. bars and line ascending of data analytics flat vector icon from user interface collection for web, mobile apps ui.
-
 Hand drawn mathematics formulas on chalkboard for background, banner,book cover and etc. for education industry
-
 Agricultural technology services blue gradient infographic 5 steps. Innovations in farming industry. Food production solutions. Flow chart infochart. Editable vector info graphics icons
-
 Agricultural technology services rectangle infographic vector. Innovations in farming industry. Food production solutions. Data visualization with 5 steps. Editable rectangular options chart
-
 Agricultural technology services infographic design template. Innovations in farming industry. Food production solutions. Data visualization 5 options. Process vertical flow chart
-
 Mixed total costs business accounting and finance vector illustration graphic
-
 Vector Trend Chart Mosaic Icon of Triangle Items
-
 Line graph vector icon
-
 Bars and line ascending of data analytics outline vector icon. Thin line black bars and line ascending of data analytics icon, flat vector simple element illustration from editable user interface
-
 Vector Trend Charts Mosaic Icon of Triangles
-
 Web banner design with user interface concept elements.
-
 User interface concept 14 colorful outline icons. 2 color blue s
-
 Vector website design template . CPQ - configure price quote, business concept. illustration for website banner, marketing materials, business presentation, online advertising.
-
 User interface concept infographic design template. included dat
-
 Vector Dollar Trends Mosaic Icon of Triangles
-
 Function color buttons. Colored icons web tools for your interface
-
 Transverse wave graph uncertainty performance statistics report
-
 Vector Chart Collage of Dots
-
 Vector Rhombus Grid Node Collage of Dots
-
 Vector Hierarchy Links Collage of Dots and Textured 3D Copy Badge
Each vector opens in a new tab with its details. Premium files are sold by Depositphotos; we may earn a commission if you buy. How this works.