Variable data symbol chart vectors
67 variable data symbol chart vector illustrations picked from 2.9M royalty-free files, with no more than 3 per artist so you see real variety. Every file is a scalable EPS that opens in Illustrator, CorelDRAW, Affinity Designer and Inkscape, and exports to SVG or PNG at any size.
-
 Data analytics icons including mining, machine learning, decision making, database, business intelligent, science, bar, line graph, scatter plot, histogram, pie chart, box, pyramid, average, variability, random sampling, frequency table, cluster
-
 Data analytics icons including scatter plot, scramble system, secure backup, shared web hosting, software developer, statistics, structure, update, timeline chart, unstructured, user analysis, variability.
-
 Bars and line ascending of data analytics icon in filled, thin line, outline and stroke style. Vector illustration of two colored and black bars and line ascending of data analytics vector icons
-
 Bars chart interface ascending icon in filled, thin line, outline and stroke style. Vector illustration of two colored and black bars chart interface ascending vector icons designs can be used for
-
 Gauss distribution. Standard normal distribution. Bell curve symbol. Math probability theory. Vector illustration isolated on white background.
-
 Gaus chart with different height columns. Normal distribution graph. Bell shaped curve template for statistics or logistic data. Probability theory math function. Vector flat illustration
-
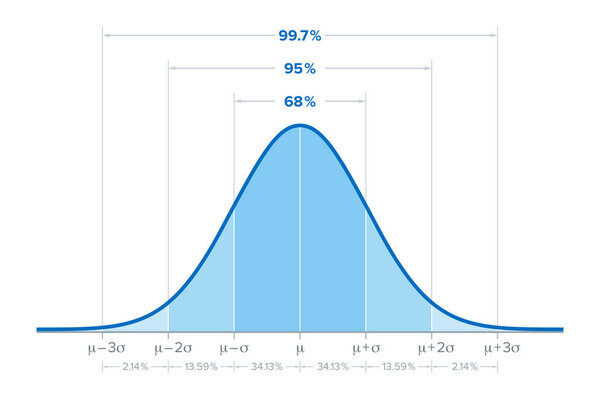 The standard deviation, sometimes called bell curve, describes the amount of variation in a data set by measuring and averaging, how much each value in the data set varies from the calculated mean.
-
 Gaussian or normal distribution graphs examples. Bell curve templates. Probability theory concept. Layout for statistics or logistic data isolated on white background. Vector illustration
-
 Standard normal distribution, also Gaussian distribution or bell curve. Used in statistics and in natural and social sciences to represent real-valued random variables of unknown distributions. Vector
-
 Bell curve symbol, a simplified diagram for a standard normal distribution, also called Gaussian distribution, used in probability theory and in statistics. Illustration on white background. Vector.
-
 Multiple variable lines icon in filled, thin line, outline and stroke style. Vector illustration of two colored and black multiple variable lines vector icons designs can be used for mobile, ui, web
-
 Normal or Gaussian distribution graph. Bell shaped curve. Probability theory mathematical function. Statistics or logistic data template isolated on white background. Vector graphic illustration
-
 Linear Bitcoin Bar Chart Trend Icon Vector Collage
-
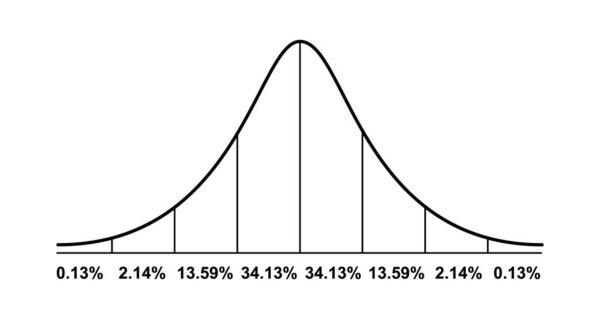 Gauss distribution. Standard normal distribution. Math probability theory. Distribution standard gaussian chart. Vector illustration isolated on white background.
-
 South Korea infographic with 3D bar and pie chart, increasing values, South Korea country flag on 3D bar graph, ups and downs data, presentation graphic idea, developing country
-
 Infographic template with icons and 8 options or steps. infographic for user interface concept. included multiple variable lines, data analytics bars, table for data, user data analytics, email
-
 Vector infographic design template with icons and 8 options or steps. infographic for user interface concept. included multiple variable lines, bad idea, blackboard with, avi extension, person
-
 Vector infographic in the form of a luminous variable graph. EPS 10
-
 Infographic template with icons and 7 options or steps. infographic for user interface collection. concept. included hidden, user data analytics, cube of squares, multiple variable lines, dual
-
 Bars and line ascending of data analytics icon in different styl
-
 Two color bars and line ascending of data analytics vector icon
-
 Two color multiple variable bars data vector icon from user inte
-
 Euro Bar Chart Vector Mesh Network Model and Triangle Mosaic Icon
-
 Chart Trend Mosaic Icon of Round Dots
-
 Vector Trend Chart Mosaic Icon of Triangle Items
-
 Vector People Trend Chart Mosaic Icon of Triangle Items
-
 Vector Rocket Bar Chart Mosaic Icon of Triangles
-
 Vector Chart Collage of Dots
-
 Vector Stock Chart Composition of Small Circles with Scratched Markets Stamp
-
 Bell curve graph, density curve graph. Gauss chart, normal distribution graph. template for statistics or logistic data. Probability theory math function. Vector flat illustration
-
 Analytics of data mining process linear pixel perfect icon. Development graph. Thin line customizable illustration. Contour symbol. Vector isolated outline drawing. Editable stroke. Arial font used
-
 Simple Silhouette Correlation Graph with Dots and Line Icon Symbol
-
 Scatter plot distribution graph icon with colorful variable points and dots for statistical correlation analysis and research scientific data evaluation
-
 Scatter plot correlation diagram line icon representing statistical data distribution analysis research variables mathematical function metric coordinates business reporting chart
-
 Modern Outline Line Stroke Scatter Plot Bubble Chart Data Display Icon
-
 Minimalist Outline Scatter Plot Graph with Regression Curve Line and Data Points Icon Symbol
-
 Analytics of data mining process black glyph icon. Development graph. Virtual information statistics. Collect and analyze digital data. Silhouette symbol on white space. Vector isolated illustration
-
 Scatter Plot Line Icon, Outline Symbol for Data Distribution, Statistical Correlation, Variable Research, Scientific Analysis, and Pattern Visualization. Vector Sign Icon.
-
 Cameroon infographic with 3D bar and pie chart, increasing values, Cameroon country flag on 3D bar graph, ups and downs data, presentation graphic idea, developing country
-
 Data mining analytics RGB color pixel perfect icon for dark theme. Graph of collected information comparison. Simple filled line drawing on night mode background. Editable stroke. Arial font used
-
 Filled user interface icons set. glyph icons such as data analysis pie chart interface, box plot, pie chart circular interface, dual bars multiple variable vertical bars, speech bubble with three
-
 El Salvador infographic with 3D bar and pie chart, increasing values, El Salvador country flag on 3D bar graph, ups and downs data, presentation graphic idea, developing country
-
 Regression analysis point A icon set collection, statistical data evaluation flat signs, mathematics variables graphic styles
-
 Correlation statistics graph. Positive and negative geometric diagram with mathematical variable and information scatter functions with vector calculations
-
 Set of 50 filled user interface icons. glyph icons such as avi extension, percentage chart, data interconnected, pen writing a line, more percentage plus button, bad idea, justified, add a like,
-
 Set of 40 filled user interface icons. glyph icons such as emot, pie chart circular interface, multiple variable point line, multiple variable vertical bars, data looping interface, multiple
-
 Data analytics icons including cloud computing, information presentation, timeline chart, complexity, automation, scalability, protocols, growing, protection, missing pattern, shared web hosting, internet server error.
-
 Vector icon of polynomial regression with a curved trend line through data points. Dark brown charcoal sketch on transparent background. Hand-drawn concept for non-linear AI modeling
-
 Equipment for Data Storage. Data Recovery
-
 Variable bars data vector icon isolated on transparent backgroun
-
 Capacitors types infographics diagram, types such as Paper,Polystyrene,Bipolar,Electrolytic,Polycarbonate,Polyester,Mylar,Silver mica,Ceramic,Tantalum electrolyte,Feed through,Trimmer,Variable. EPS10.
-
 Web stocks data line graphic interface vector icon isolated on t
-
 Web stocks data line graphic interface symbol icon vector isolated on white background for your web and mobile app design, Web stocks data line graphic interface symbol logo concept
-
 Variable capacitor diagram and text information pattern on glass banner,vector illustration design,eps10.
-
 Scatter plot shows a perfect degree of positive correlation
-
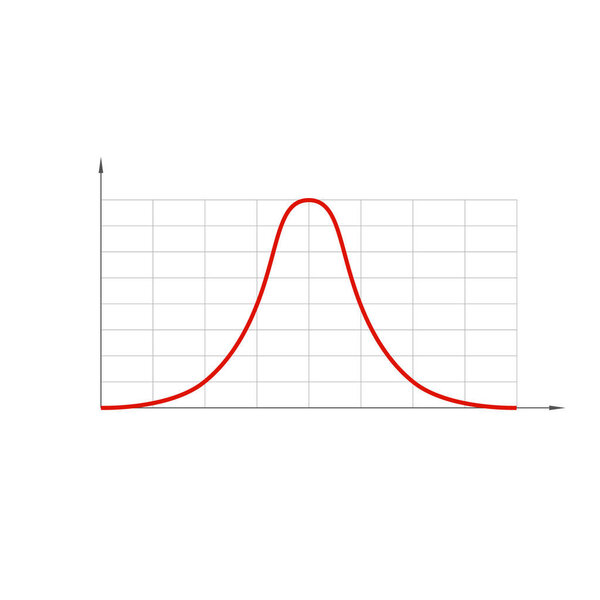 Standard normal distribution, also Gaussian distribution or bell curve.
-
 Degree of correlation. Scatter plot
-
 Scatter plot shows a weak degree of positive correlation
-
 Variability vector icon Linear icon. Editable stroked line
-
 Line graph vector icon
-
 User ascending icon in outline style. Icon for user management.
-
 Kurva icon illustration logo design
-
 Scatter plot icon. Thin, Light Regular And Bold style design isolated on white background
-
 Symbolic minimalist illustration. Thermometer icon with up and down arrows, suggesting temperature fluctuations. Useful for weather, healthcare, or datadriven design projects.
-
 Bidirectional Arrows solid icon vector design good for web or mobile app
-
 Bidirectional Arrows outline icon vector design good for web or mobile app
-
 A graphic representation of a piecewise linear function with saturation on an orange circular background.
Each vector opens in a new tab with its details. Premium files are sold by Depositphotos; we may earn a commission if you buy. How this works.