Variable analysis vectors
69 variable analysis vector illustrations picked from 10.2M royalty-free files, with no more than 3 per artist so you see real variety. Every file is a scalable EPS that opens in Illustrator, CorelDRAW, Affinity Designer and Inkscape, and exports to SVG or PNG at any size.
-
 100 ui outline icons set such as web crawler, 3d data analytics dual bars, data search for interface, bars and line ascending of data analytics, analysis pie chart interface, multiple variable
-
 Machine icons set with analysis design, computer cooler, gear algorithm and other variable architecture elements. Isolated vector illustration machine icons.
-
 Collage No analysis retort icon organized from square items in variable sizes and color hues. Vector square items are organized into abstract composition no analysis retort icon.
-
 Digital analysis checks the company's financial health performance.
-
 Vector statistical icons of correlation types. Positive, negative, no correlation. The relationship between two data sets or two random variables. Graphs or charts.
-
 Data analytics icons including scatter plot, scramble system, secure backup, shared web hosting, software developer, statistics, structure, update, timeline chart, unstructured, user analysis, variability.
-
 Correlation is a statistical measure that expresses the extent to which two variables are linearly related
-
 Break even point, profit, loss from revenue compare with fixed cost and variable cost
-
 Set of scatter plot diagrams. Scattergrams with different types of variables negative correlation. Data points plotted on a horizontal and a vertical axis on Cartesian plane. Vector flat illustration
-
 Set of scatter plot diagrams. Scattergrams with different types of variables correlation. Data points plotted on a horizontal and a vertical axis on Cartesian plane. Vector flat illustration
-
 Multiple variable lines outline vector icon. Thin line black multiple variable lines icon, flat vector simple element illustration from editable user interface concept isolated on white background
-
 Multiple variable lines icon in filled, thin line, outline and stroke style. Vector illustration of two colored and black multiple variable lines vector icons designs can be used for mobile, ui, web
-
 Multiple variable vertical bars icon in filled, thin line, outline and stroke style. Vector illustration of two colored and black multiple variable vertical bars vector icons designs can be used for
-
 Standard normal distribution, also Gaussian distribution or bell curve. Used in statistics and in natural and social sciences to represent real-valued random variables of unknown distributions. Vector
-
 Genetic Analysis Composition of Cannabis
-
 Two scientists, a woman and a man, are studying complex mathematical formulas written on a blackboard, engaging in scientific discussion and analysis
-
 Break-even analysis infographic template with cost revenue profit line chart diagram, flat style vector
-
 Break-even analysis infographic template with sales units line chart card diagram, flat style vector
-
 Set of 16 vector stroke icons such as pie chart analysis interfa
-
 Two color multiple variable vertical bars vector icon from user
-
 Data indicators metrics. Statistics variable, measurable information of outcomes vector monocolor illustration
-
 Blood analysis Mosaic Icon of Rugged Elements
-
 Standard deviation as statistics mathematical calculation outline diagram. Labeled educational scheme with sample mean, observed value and formula explanation vector illustration. Math data analysis.
-
 Forex statistics, financial analytics dashboard graph, line and arrows vector illustration
-
 Bangladesh 3D bar chart graph with ups and downs, increasing values, Bangladesh country flag on 3D bar graph, upward rising arrow on data, news banner idea, developing country concept
-
 Break even point or BEP or Cost volume profit graph of the sales units and the revenue sales
-
 Moldova 3D bar chart graph with ups and downs, increasing values, Moldova country flag on 3D bar graph, upward rising arrow on data, news banner idea, developing country concept
-
 Data analytics icons including mining, machine learning, decision making, database, business intelligent, science, bar, line graph, scatter plot, histogram, pie chart, box, pyramid, average, variability, random sampling, frequency table, cluster
-
 Vote members statistics levels icon sign vector
-
 Security Assessment System for Big Data Servers
-
 Cvp cost volume profit concept with big word or text and team people with modern flat style - vector
-
 API Application Programming Interface with Laptop, Pencil, Cloud Data
-
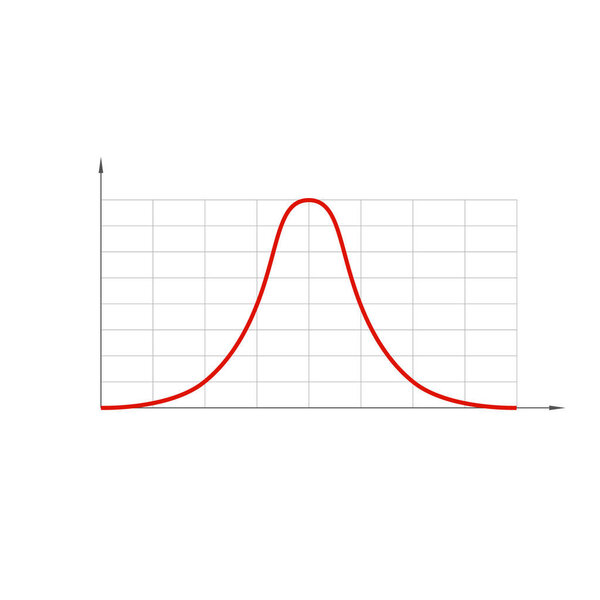 Standard normal distribution, also Gaussian distribution or bell curve.
-
 Degree of correlation. Scatter plot
-
 Scatter plot shows a perfect degree of positive correlation
-
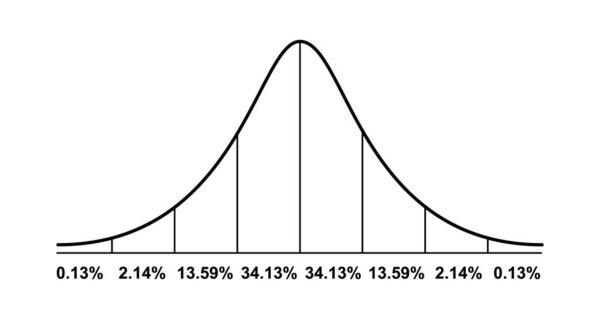 Gauss distribution. Standard normal distribution. Math probability theory. Distribution standard gaussian chart. Vector illustration isolated on white background.
-
 Math formula icon on white background. formula I symbol. math formula sign. flat style.
-
 Timeline template
-
 Scatter plot shows a weak degree of positive correlation
-
 Structure Immunoglobulin Molecule.
-
 Concept Line Icons Set 14 Math
-
 Mathematics banners. Flat vector education concept of math, algebra, calculus. Vertical layout composition.
-
 Antibody logo vector
-
 Grunge red break even point word with star icon round rubber seal stamp on white background
-
 The structure of the antibody (immunoglobulin). Antibody binds to a specific antigen
-
 Alphabet letter in word parameter on crossword puzzle background
-
 Hypothesis testing and scientific experiment research outline diagram. Labeled educational scheme with alternative accepted and null not rejected hypothesis vector illustration. Opinion proof method.
-
 B cell lymphocyte producing antibodies
-
 Antibody molecule conjugated with fluorophore
-
 South Korea infographic with 3D bar and pie chart, increasing values, South Korea country flag on 3D bar graph, ups and downs data, presentation graphic idea, developing country
-
 Antibody immunoglobulin molecule structure
-
 API Application Programming Interface
-
 The Spectroscope or spectrophotometer, vintage engraving.
-
 Feature for AI icon. Simple outline monochrome black vector pictogram with thin lines on a transparent background. Line thickness is editable
-
 Label banner that have yellow headline with word hypothesis and white copy space, on gray background
-
 Energy demand or electricity consumption with increased price outline concept. Power market analytic and forecasting with expensive peak hours vector illustration. Financial diagram with supply data.
-
 Financial literacy color icons set
-
 Three beakers showing increasing water levels
-
 Break-even point infographic template with formula key element line chart diagram, flat style vector
-
 Variability vector icon Linear icon. Editable stroked line
-
 Vector Trend Charts Mosaic Icon of Triangles
-
 Vector Trend Chart Mosaic Icon of Triangle Items
-
 CVP - Cost Volume Profit acronym, business concept background
-
 Vector Statistics Charts Mosaic Icon of Triangle Items
-
 Fluctuating bar graph background close up
-
 Vector Chart Collage of Dots
-
 Vector Down Trend Composition of Dots and Grunge Depression Seal
-
 Transverse wave graph uncertainty performance statistics report
-
 Profit loss chart. Zigzag arrow line. Vector business graph. Rising rebound concept. EPS 10.
Each vector opens in a new tab with its details. Premium files are sold by Depositphotos; we may earn a commission if you buy. How this works.
