Trend chart vectors
100 trend chart vector illustrations picked from 17.8M royalty-free files, with no more than 3 per artist so you see real variety. Every file is a scalable EPS that opens in Illustrator, CorelDRAW, Affinity Designer and Inkscape, and exports to SVG or PNG at any size.
-
 Growing bull trend chart
-
 Solid design of trend chart
-
 Modern geometric composition of various shapes.Background in the trend chart. Portrait of a young girl.
-
 Modern geometric composition of various shapes. Illustration for design. Abstract background in the trend chart.
-
 Trend Chart Flat Vector Icon With Bonus
-
 Vector Dotted Trend Chart Icon and Grunge Silk Road Seal
-
 Stock market trading technical analysis bar chart fall. Business candlestick graph exchange down trend. Crisis economy and investment loss graph. Trader financial index crash concept. Eps banner
-
 Financial Performance Analytics Dashboard Metrics KPI Revenue Growth CAC Reduction Trend Uptrend Chart Bars Data Visualization Reporting Strategy Green Gradient Vector Illustration.
-
 Stock market investment trading illustration concept. Financial bar chart, yield curves, bond data, and upward-sloping graph on a white background. Business candlestick trend graph
-
 Bar chart with arrow. business analytics graph with growing trend in flat style
-
 Flat vector illustration of a info chart showing increase visualized by green arrow growing up in steps with green bars for trends, market analysis and investment success diagram
-
 Growth chart icon. Statistical data graphic. Upward trend illustration. Vector concept. EPS 10.
-
 Stock market or forex trading graph in futuristic concept for financial investment or economic trends business idea. Financial trade concept. Stock market and exchange Candle stick graph chart vector.
-
 Stock market investment trading technical analysis candlestick chart on white background. Business candle stick graph exchange trend. Trader financial investment index concept vector illustration
-
 Orange bar chart with a fluctuating line and arrow showing data trends and economic changes. Ideal for finance, statistics, growth analysis, business strategy, market forecasting, education
-
 Financial data graph chart , abstract financial chart with trend line graph and candle stick in stock market.
-
 Abstract financial chart with uptrend line graph in stock market on blue background. Business chart. Graph chart of stock market investment trading. Trend of graph vector design.
-
 Business trading graph investment growth 2024 year on blue background. economy world chart trading technology. global trend arrow up. vector illustration digital low poly fantastic design.
-
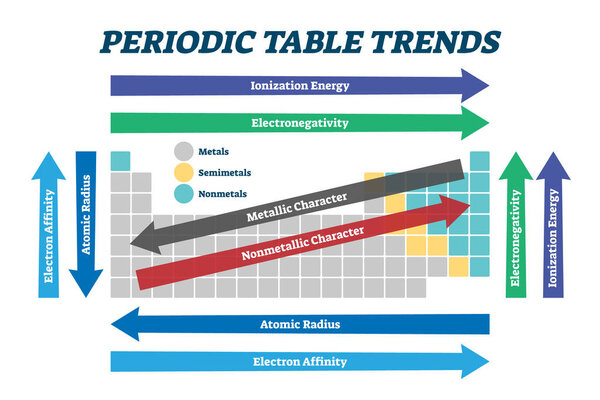 Periodic table trends chart, vector illustration scheme
-
 A luxury, gold graph for Stock market charts and forex trading graph in up trend concept for financial investment or Economic trends business idea, For down trend grapghs
-
 3D digital economy positive trend concept. Finance business idea increase profits marketing. Investment control hand pen drawing graphic vector illustration
-
 Business Chart Icons Set Flat
-
 Set of charts
-
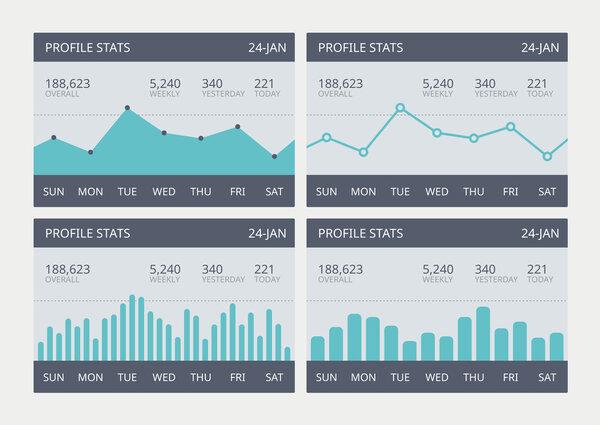 Vector business statistic charts set
-
 Declining graph icon - declining chart icon
-
 Set of business flat, 3D design graph. Infographics charts.
-
 Bar Chart Graph Diagram Statistical Business Infographic Illustration
-
 Set of info chart doodle
-
 Business data market charts diagrams and graphs
-
 Example of business flat design graph. Infographics chart.
-
 Business Analysis symbol with magnifying glass icon and pie chart.
-
 Infographic dashboard template with flat design graphs and charts. Processing and analysis of data
-
 Four types of business charts
-
 Glowing vector chart of investment financial data. Infographic elements and realistic transparent world map
-
 Stock trading japanese candlesticks trading chart vector illustration isolated on white background
-
 Candle stick chart investing illustration. Bullish uptrend. Suitable for stock exchange, forex trading and crypto price analysis.
-
 Financial chart with uptrend line graphs and candlesticks. Abstract infographics visualization. Graphic concept for your design
-
 Stock market or forex trading graph. Chart in financial market vector illustration Abstract finance background.
-
 World stock market index graph. Candlestick chart, line graph and bar chart. Stock market growth illustration. Financial market background. Blue color. Vector illustration
-
 Graph line chart financial statistic Infographics and diagnostics, charts and schemes vector. Business vector element
-
 Draw growth chart
-
 Candle stick graph chart of stock market investment trading, Stock exchange concept design and background. Vector illustrations.
-
 Investing background. Candlestick charts for stock exchange with dot world map in background. Stock market conceptual background.
-
 Concept of increasing income or salary, growth of investment profit or income from stock market, growth of money or wages, businessman with magnifying glass on dollar sign with growth charts and graphs.
-
 Bitcoin price history. Infographics of changes in prices on the chart from 2009 to 2017. Diagram. Blocking system. Vector illustration
-
 Forex chart backdrop with candlestick and index grid.
-
 Financial stock market graph on stock market investment trading, Bullish point, Bearish point. trend of graph for business idea and all art work design. vector illustration
-
 Bearish market trend in cryptocurrency or stocks. Trade exchange background.
-
 Market Trend icon set. Prediction, Market Sentiment, Stock Exchange, Investment, Trader, Price, Trading Strategy, Profit. Duotone color solid icons
-
 Technical analyze graphic with candlestick chart illustration. market volatility chart for stock trading, cryptocurrency background.
-
 Business stock market investment graph growth technology background. chart economy forex finance increase rise. vector illustration fantastic hi-tech design.
-
 Stock market investment trading graph concept background. Economic trends, forex and crypto graphic. Vector illustration. EPS 10.
-
 Four colorful lines are representing data trends over twelve months, from january to december, creating a visual representation of performance and fluctuations
-
 Stock market or forex trading chart background in perspective graphic design for financial investment concept
-
 Candlestick chart of trading on the stock exchange. Trading cryptocurrency, stocks and bonds. Candlestick patterns in cryptocurrency trading. Design for banners and posters. Vector illustration
-
 Stock market investment trading graph or forex graph global network line wire frame data business concept for financial investment economic trends vector illustration
-
 Flat design bar graph - template for annual reports or presentation shots. Easy to edit statistic chart in corporate colors.
-
 Digital growth graph chart with up arrow on technology blue background. Business and financial concept. Stock market and investment symbol. Low poly wireframe vector illustration in futuristic style.
-
 Business financial stock trading chart with ascending graph and growth lines on white background.
-
 Market trends icon. Market trends design concept from Economyandfinance collection. Simple element vector illustration on white background.
-
 Chart for infographics. Lined graph.
-
 Japanese candlestick chart
-
 Chart of business data growth graph
-
 Business investment trading stock growth on tablet. finance forex trade candlestick technology. Economy trends graph stock market statistics. vector illustration fantastic technology.
-
 Growth chart hand drawn icon
-
 Stock chart That is said to be showing progressive growth of the company, increasing revenues of the company and expanding into different countries. Dark blue background and grid lines
-
 Vector background with stock market candlesticks chart. Forex trading creative design. Candlestick graph illustration for trade analytics
-
 Forex stock chart. Data candle graph.
-
 Business chart 1
-
 Blue Light Negative Bar Graph Chart Depreciation Business Economic Recession
-
 Demand forecasting is shown with icons of growth charts, magnifying glass, and checklist, representing prediction and analysis. Outline icons set
-
 World stock market index graph. Candlestick chart, line graph and bar chart. Glow light. Stock market growth illustration. Financial market background. Dark Blue color. Vector illustration
-
 Financial line chart diagram with ascending graphs on white background,abstract financial chart with sideways line graph and candlestick on white background
-
 Two arrows pointing up represent financial chart
-
 Stock market charts and graphs
-
 Stock market growth in futuristic technology style. Successful financial graphic on blue background. Business growth illustration with the bar chart static and up arrow.
-
 Vector infographics set. 20 best sellers of 2018. Business diagrams, arrows graphs, startup presentations and idea charts.
-
 Tablet with stock trade graph web banner. Financial analytics vector illustration. Stock exchange market chart graphic design concept.
-
 World stock market index graph. Candlestick chart, line graph and bar chart. Stock market growth illustration. Financial market background. Dark Blue color. Vector illustration
-
 Investing subtle background. Candle stick charts for stock exchange with dot world map in background. Stock market conceptual background.
-
 A digital representation of stock market performance with connected dots illustrating data points and trends
-
 Abstract financial chart with uptrend line graph and candlestick on black and white color background. Vector
-
 Trend icon. Thin linear trend outline icon isolated on white background from marketing collection. Line vector sign, symbol for web and mobile
-
 Bangladesh 3D bar chart graph with ups and downs, increasing values, Bangladesh country flag on 3D bar graph, upward rising arrow on data, news banner idea, developing country concept
-
 Growth graph chart and up arrow. Abstract finger touching on chart bar. Histogram in technology light blue hologram style. Finance and stock market concepts. Low poly wireframe vector illustration.
-
 Dotted Positive Trend Vector Toolbar Icon
-
 Stock market or forex trading chart with indicator in graphic design concept, vector illustration
-
 Chart arrow course
-
 India 3D bar chart graph with ups and downs, increasing values, India country flag on 3D bar graph, upward rising arrow on data, news banner idea, developing country concept
-
 Business financial blue abstract background with uptrend candle stick pattern of stock market, investment growth success finance business chart
-
 3D Red Arrow Pointing Up with Grid and Line Graph, Business Growth, Economic Boom, Profit Trend
-
 Linear Trend Vector Mesh
-
 Modern Design Minimal jigsaw style infographic
-
 Data analysis icon
-
 Abstract Rising Arrows
-
 Graphs
-
 Infographics vector design template. Paper Ribbons.
-
 Infographics vector design template. Creative diagram.
-
 BusinessPeople and Falling Down Financial Bar
-
 Carefully curated 36 Heavy Line vector icons for Bar Graph, featuring 128x128 PIXEL perfect resolution for consistent brand representation and user experience.
Each vector opens in a new tab with its details. Premium files are sold by Depositphotos; we may earn a commission if you buy. How this works.