Rise graph chart vectors
100 rise graph chart vector illustrations picked from 5.8M royalty-free files, with no more than 3 per artist so you see real variety. Every file is a scalable EPS that opens in Illustrator, CorelDRAW, Affinity Designer and Inkscape, and exports to SVG or PNG at any size.
-
 Growth & Progress Bar Chart
-
 Bar Graph
-
 3d business growth bar graph
-
 Vector colored numbered charts
-
 Rising graph simple web icon
-
 Graph up
-
 Rising bar graphs
-
 Businessman climbing up on a ladder to adjust an uptrend graph chart on a wall.
-
 Business candle stick graph chart of stock market investment trading on blue background. Bullish point, up trend of graph. Economy vector design.
-
 Isometric graph chart vector illustration set, 3d infographic element, diagram bar with stats percent or graphic pie chart isolated on white
-
 Education icons set. Included icon as Graph chart, Cogwheel, Update data signs. Speech bubble, Feedback, Line graph symbols. Creativity, Report line icons. Growth report, Engineering. Vector
-
 Increase profit sales diagram. Hand with business chart growth in flat style design. increasing graph investment revenue with line arrow and businessman hand vector illustration concept to success
-
 Financial graph chart. Business data analytics. Diagram growth and success in business. vector
-
 Vector business graph
-
 Vector line graph element. Modern simple chart background.
-
 Set of Science icons, such as Graph chart, Demand curve, Patient history symbols. Mobile screen mockup banners. Cloud share line icons. Growth report, Statistical report, Medical survey. Vector
-
 Stock market background or forex trading business graph chart for financial investment concept of Jamaica map. business idea and technology innovation design.
-
 Financial data graph chart on grey background. Business background with candlesticks chart for reports and investment. Financial market trade concept.
-
 Stock market and exchange. Candle stick graph chart of stock market investment trading. Stock market data. Bullish point, Trend of graph. Vector illustration
-
 Stock market or forex trading graph chart suitable for financial investment concept. Economy trends background for business idea. Abstract finance background. Vector illustration.
-
 Stock market and exchange. Business Candle stick graph chart of stock market investment trading. Stock market data. Bullish point, Trend of graph. Vector illustration.
-
 Stock market or forex trading graph. Chart in financial market vector illustration Abstract finance background.
-
 Stock market background or forex trading business graph chart for financial investment concept of Albania map. business idea and technology innovation design.
-
 Stock market background or forex trading business graph chart for financial investment concept. Business presentation for your design. Economy trends, business idea and technology innovation design.
-
 Pencil, Analytical chat and Data analysis icons set. Online statistics, Sales diagram and Graph chart signs. Vector
-
 Marketing Concept of Product Life Cycle Graph Chart
-
 Set flyer, brochure size A4 template,banner.Stock market or forex trading graph. Chart in financial market vector illustration Abstract finance background
-
 Simple set of diagram and graphs related vector icons for your design. Simple Set of Graph Related Vector Line Icons. Contains such Icons as Pie Chart, Graphic, Statistics, Column Chart and more.
-
 3d graph showing rise in profits or earnings
-
 Businessman pulling arrow graph chart up with a rope.
-
 Business couple with bar charts avatar character
-
 Businessman with a growing sales chart
-
 Pie chart, graph, presentation black line icons set - business, finance concept - big pack
-
 Successful businessman with a chart going up
-
 Vector growing graph chart background.
-
 Graph and flow diagram
-
 Busines down shiny chart width negative arrow
-
 Blue business arrow rising up with dots followed by line graph going up, trading profit, economic boom, business growth
-
 Curved Blue Business Arrow Graph Pointing Up on Grid Background with Two Line Graph Representing Profit, Progress, Growth, and Success
-
 Financial graph growth up. Increase profit. Green arrow up. Success on economy or trade. Rise price.
-
 Bar chart with arrow. business analytics graph with growing trend in flat style
-
 Concept of increasing income or salary, growth of investment profit or income from stock market, growth of money or wages, businessman with magnifying glass on dollar sign with growth charts and graphs.
-
 Profit performance graph
-
 Economic graph with diagrams on the stock market, for business and financial concepts and reports. Abstract white vector background.
-
 Economy chart
-
 Growing cash graph. Pile of cash, money value red rising graph arrow and financial growth diagram vector illustration
-
 Blue business arrow graph going up consistently with grid background represents trading profit business growth economic boom and financial surplus
-
 Economic recovery from money stimulus, leadership to grow business, business leader standing on profit bar chart watering this year bar chart growth, investment growth or profit and income concept.
-
 3d business graph with red rising arrow
-
 Businessman investor looking at dollar sign rocket flying high on stock chart. US Dollar value rising due to increase in interest rate, economic or investment concept, exchange rate or financial reports.
-
 Trends graph vector
-
 Graphs with arrows table.
-
 Financial graph
-
 Vector 3d bar graph
-
 Vector illustration of Business team building growth graph and preparing for the big profit. Candlestick chart of the stock market, move up motivation. The way to achieve the goal
-
 Cartoon of Business People Applauding to Speaker Pointing at Growth Chart
-
 Calculator and business report with rising graph. Vector illustration.
-
 Abstract arrow growing up graph success blue vector background
-
 Graph with an arrow
-
 Stock market, economic graph with diagrams, business and financial concepts and reports, abstract technology communication concept vector background
-
 Financial chart with the two arrows Forex lines of arrows.
-
 Business data analytics. Financial graph chart. Graph chart of stock market investment trading. Abstract analisys and statistic diagram. vector illustration
-
 Blue Stats Graph
-
 Business and Marketing Concepts, 4 Stage of Product Life Cycle. Product life cycle graph 4 stage.
-
 Graph
-
 Business strategy growth digital technology. Stock trading. Digital graph chart increase. Business on successful. Low poly diagram wireframe.
-
 Bar graph growth and up arrow
-
 Drawing of graph on blackboard
-
 Bar shiny 3d graph positive arrow
-
 Stock market investment trading technical analysis bar candlestick chart. Business exchange growing trend graph. Trader financial investment growth moving up index banner concept. Eps
-
 Stock market investment graph growth technology. profit and finance diagram arrow up. trading chart increase. vector illustration fantastic hi tech design.
-
 Demand curve example. Graph representing relationship between product price and quantity. Economics model isolated on white background. Vector graphic illustration
-
 Business graph and green arrow icon. Vector
-
 Business investment stock chart increase digital technology. vector illustration hi-tech. financial data strategy. market chart profit money. arrow up trading to success. diagram economy growth.
-
 Stock market trading technical analysis bar growing candlestick chart. Business exchange bullish trend graph. Trader financial investment growth moving up index eps banner. Savings and income concept
-
 Screen arrow graph down
-
 Profits Up Graph Paper
-
 Businessman flying up above the chart as the graph going uptrend.
-
 Business person chart help red ink to profitability
-
 Graph showing rise
-
 Candlestick charts used for stocks, Forex and cryptocurrencies, rising, white background
-
 Graph with arrow and increase report. Diagram with the progress of rise and success. Vector illustration
-
 Business investment graph arrow growth up. chart finance increase. isolated on blue dark background. vector illustration fantastic low poly wireframe design.
-
 Positive business sales graph on wood background
-
 Support and resistance candlestick candle chart in stock market technical analysis vector
-
 White bar graph against a soft blue background symbolizes financial growth and modern data analysis for corporate reports and business presentations, ideal for conveying progress and success
-
 Rising Stock Chart Technology Interpreting technology in the world is advancing and growing all the time. Tech-related businesses are growing rapidly. It also helps to push people's well-being better
-
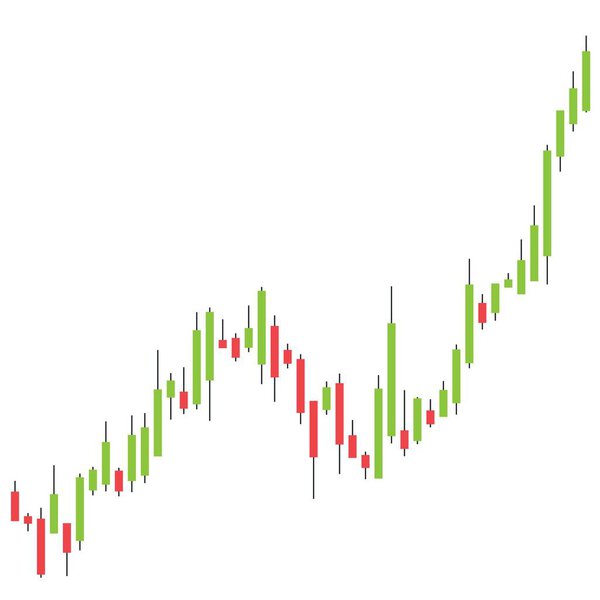 Candlestick graph. Stock market trading chart, also used for currency and crypto markets. Up trend - bullish uptrend. Market going up.
-
 Business person climbs up marketing sales chart
-
 Abstract financial ascending linear graph with numbers
-
 Success graph
-
 Candlestick chart. stock and line charts. colored financial graph
-
 Business statistics graph diagram with bars
-
 Minimalist stile. vector business finance. Profit concept, growing business graph. manages financial growth graph. Template investment. Vector illustration flat design.Symbol leadership, strategy, mi
-
 Graph with increase report. Diagram with rise and gain progress. Vector illustration
-
 IPO or Initial Public Offering corporate stock market, company growth concept. Design by financial charts elements and rocket flying. Vector illustration of startup investment and strategy style
-
 Exponential growth or compound interest, financial chart illustration with upward arrow resembling soaring rocket.
-
 Business chart
-
 Chart in economy- business
-
 Creative vector illustration 3d arrow financial growth, graphic grow banner background. Art design business presentation layout template. Abstract concept chart sales element
Each vector opens in a new tab with its details. Premium files are sold by Depositphotos; we may earn a commission if you buy. How this works.