Result chart vectors
100 result chart vector illustrations picked from 16.3M royalty-free files, with no more than 3 per artist so you see real variety. Every file is a scalable EPS that opens in Illustrator, CorelDRAW, Affinity Designer and Inkscape, and exports to SVG or PNG at any size.
-
 Vector circle puzzle infographic, cycle diagram, graph, presentation chart. Business concept with 2 options, parts, steps, processes. From idea to result. 16x9 dark slide template.
-
 Rating of candidate. Result of voting for president. Chart, analysis graph.
-
 Presentation of successful Economic Results, flying man,tearing paper. Stylized male silhouette ripping paper and uncovering economic charts. Vector available.
-
 Business Chart Icons Set Flat
-
 Process chart template 2
-
 Big data processing and analysis isometric icon, smart business technology, laptop with magnifying glass and chart
-
 Results graph drawn by hand
-
 Process chart template 7
-
 Infographic Concept - Flow Chart Design - Timeline
-
 Business graph and chart
-
 Growth charts indicators with reflection on a light blue background
-
 Financial chart
-
 Concept of increasing income or salary, growth of investment profit or income from stock market, growth of money or wages, businessman with magnifying glass on dollar sign with growth charts and graphs.
-
 OKR Objectives and Key Results infographic template with cycle circular round rectangle with puzzle jigsaw connection with dark background style with 3 point for slide presentation vector
-
 Iceberg infographic. 3 steps to success. Presentation slide template. Startup business. Analytics of the processes that led to a successful result.
-
 Iceberg infographic. 5 steps to success. Presentation slide template. Startup business. Analytics of the processes that led to a successful result.
-
 Data analysis design concept. Analysis working. Small people with data analysis graphs ansd charts. Vector illustration.
-
 Infographics goals Business goals. Strategy, analysis, growth, result, marketing.
-
 Business charts and quotes
-
 Business report, paper document with magnifying glass. Isolated icon with long shadow. Charts graphs on a paper. Accounting, analysis, research, planning, audit, report, management. Vector
-
 Magnifying Glass and Multicolored Pie Chart
-
 Pareto principle - 80/20 rule. Law or theory efficiency and productivity. 80 percentage effort 20 percentage result. Success rule. Infographic diagram.
-
 Vector Business Growing Chart Presentation Icon
-
 Financial Report Icon Graph Chart Vector Pack
-
 Rising dollar price chart and bar graph icon. Editable vectors.
-
 Flat illustration of businessman analyzing business finance and investment performance using report dashboard with data chart and tracking graph
-
 Businessman surfing on the chart line
-
 Graph chart sign icon. Diagram symbol.
-
 Data analysis concept, statistics for analysis, business graph dashboard, marketing research, diagrams for optimization, big information, businessman marketing team analyzing graphs and charts.
-
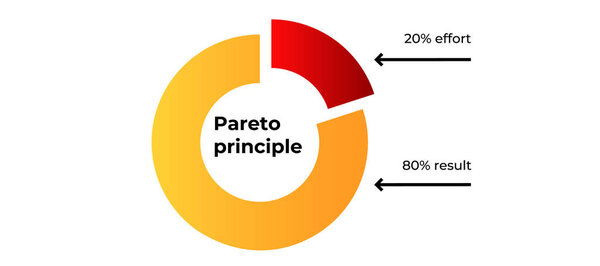 This diagram illustrates the pareto principle, indicating that 20 of effort leads to 80 of results.
-
 Isometric vector image on a blue background, business tablet with charts and magnifier, financial analytics.
-
 Website analysis. Web audit icon of vector SEO or search engine optimization research statistic infographics, thin line web page and pie charts. Website development, digital business and ecommerce
-
 Data analytics, research or analysis graph and chart diagram, statistics report, datum or financial analysis, marketing for website, optimization concept, businessman analyze data on monitor screen.
-
 Chart
-
 Data analysis research statistics concept. Strategy, business development. Results of statistical business research. Analyze growth of statistical indicators, income. Finance data and profit growth
-
 Creative vector illustration 3d arrow financial growth, graphic grow banner background. Art design business presentation layout template. Abstract concept chart sales element
-
 Business report, paper document. Isolated icon with long shadow. Charts graphs on a paper. Accounting, analysis, research, planning, audit, report, management. Vector
-
 Flat Hand Loupe Clipboard Chart Drop
-
 Net promoter score analysis. NPS indicator template. Example of positive client loyalty with different quantitative results. Customer satisfaction metric. Vector flat illustration
-
 Business report, office folded paper document. Isolated icon with long shadow. Charts graphs on a paper. Accounting, analysis, research, planning, audit, report, management. Vector
-
 Businessman analyzing data with charts chart and diagram dashboard, and magnifying glass financial graph statistics, SEO or optimization concept
-
 Data analytics concept, statistics to analyze, diagrams for optimization, business graph dashboard, marketing research, big data and information concept, business people analyze graphs and charts.
-
 Revenue or salary increase, growth investment profit or earning from stock market, money or wages growing concept, businessman with magnifying glass on dollar money sign with growth graph and chart.
-
 Halftone collage. Hand holding magnifying glass with arrows pointing up. Market chart, finance graph. Trending upwards. Business data, trend. Modern stock design. Vector art.
-
 Businessman flying up above the chart as the graph going uptrend.
-
 Color pie chart with text
-
 Chart World down
-
 Risk evaluation business. Concept of audit, financial analysis. Vector flat color icon illustration. Magnifying glass over chart icon with shield. Design element for banner, poster, web, background.
-
 Audit graph data analysis result
-
 Benchmark performance or KPI key performance indicator, metrics or measurement to measure success, result evaluation, analysis or comparison concept, businessman magnify benchmark metric graph scale.
-
 Magnifying glass and pie chart
-
 Magnifying glass and pie chart infographic
-
 Glowing vector chart of investment financial data. Infographic elements and realistic transparent world map
-
 Business Ratings and Charts Collection. Infographic Elements
-
 Businessman climbing up on a ladder to adjust an uptrend graph chart on a wall.
-
 Golden and gray pie chart two piece
-
 This business women and this business man are very happy because they are presenting very good business results of the company
-
 Data analysis, infromation searchning, data center query, search engine optimization, concept site position result, laptop with paper bill magnifying glass isometric vector ultraviolet
-
 Charts and Graphs Collection
-
 Chart growth with arrow up
-
 Business analytics, statistical data, progress tracking, marketing growth, financial performance, corporate strategy. Bar graph, pie chart and upward arrow. Business analytics and statistical data
-
 Revenue or salary increase, growth investment profit or earning from stock market. Businessman with balloon on dollar money sign with growth graph and chart. Money or wages growing concep
-
 Data analysis for business insight, intelligence information on marketing research, analytics or data visualization dashboard, project chart and graph concept, businessman analyze data with lightbulb.
-
 Exponential growing curve above a bar chart shaded with hand drawing strokes in black and white. Illustration as design element for the topics of business, sale performance, profit and revenue
-
 Simple infographic for problem solving process visualization with colorful pie chart and icons. Easy to use for your website or presentation.
-
 Vector web banner for business analytic finance graph report and business investment planning concept
-
 Colorful 3d circular diagram
-
 Income growth presentation and showing financial stats tiny person concept
-
 One hand holding document with a diagram and another hand holding magnifier over it. Vector illustration in flat style
-
 Lineo Editable Stroke - Diagrams and Graphs line icons
-
 Graph and flow diagram
-
 KPI or key performance indicator outlined measurement vector illustration.
-
 SEO Analysis concept. Flat style illustration. Isolated on white background.
-
 Isometric vector image on a blue background, a male hand holds a magnifying glass in front of a triangular diagram, studying financial statistics and data
-
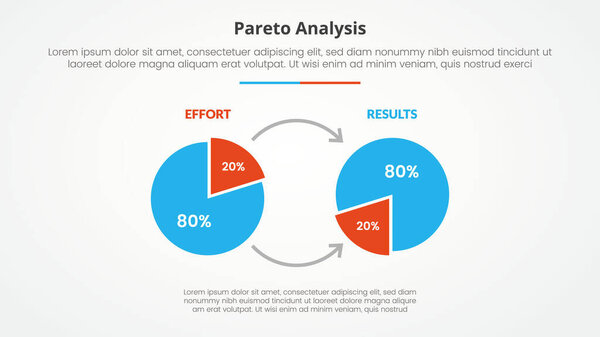 Pareto principle analysis 80 20 rule template infographic concept for slide presentation with 2 piechart with arrow direction pointing with 2 point list with flat style vector
-
 Hand care with up arrow and financial bar
-
 SEO optimization concept. Search engine optimization strategy. Data analytics. Content development and production. Vector illustration
-
 Flat vector illustration of web analytics information and development website statistic
-
 Search Engine Optimization Pyramid - process of improving the quality website traffic to a website or a web page from search engines, concept for presentations and reports
-
 Bar Graph
-
 Data analytics, dashboard and business finance report. business people working for data analytics and monitoring on web report. business finance investment concept. Vector illustration in flat style
-
 The lifting schedule
-
 Rising graph simple web icon
-
 Seo analysis program colorful banner
-
 Concept banner of business analytics.
-
 Upside down arrow with abstract globe and financial char bar
-
 Business diagram for design
-
 Colorful 3d bar graph
-
 Data analysis 3d isometric style illustration with people around laptop
-
 Profit design
-
 Analytics search information
-
 Business benchmarking flat isometric vector.
-
 Concept Vector Illustration in Flat Design Style of Web Analytics Information
-
 Finance report. concept flat style
-
 Market analysis flat line icon
-
 Data analytics information and web development website statistic. Vector illustration
-
 Annual report background.
-
 Analytics infographics pictogram. Strategy, management and marketing.
-
 SEO Marketing strategies in PC monitor
-
 Investment business analysis data
Each vector opens in a new tab with its details. Premium files are sold by Depositphotos; we may earn a commission if you buy. How this works.