Rate graph vectors
100 rate graph vector illustrations picked from 9M royalty-free files, with no more than 3 per artist so you see real variety. Every file is a scalable EPS that opens in Illustrator, CorelDRAW, Affinity Designer and Inkscape, and exports to SVG or PNG at any size.
-
 Stock exchange board, market index graphs and charts, vector background. Stock exchange board prices on screen display, tickers, financial data numbers and electronic trade rates
-
 Stock exchange board, market index graphs and charts, vector background. Stock exchange board display with prices and currency financial data of electronic trade rates
-
 Stock exchange board background, market index graphs and charts, vector ticker display. Stock exchange screen with financial trade index rates, finance fund stocks price increase and decrease charts
-
 Dashboard graph of forex statistics, business and financial analytics, profit and cost rate, vector illustration
-
 Financial stock market graph on stock market investment trading, Bullish point, Bearish point. trend of graph for business idea and all art work design. vector illustration.
-
 Set of blue-themed financial graphs depicting data trends, including line and area charts. Illustrating business growth and analytics. Concept of economics, financial analytics and growth
-
 Vector business graph
-
 Sales growth abstract concept vector illustration. Profit plan, client database growth, sales manager, promotion method, marketing goal, salesman achievement, rate formula abstract metaphor.
-
 Business graph and chart
-
 Abstract background with stock graph. Eps10 Vector illustration.
-
 Graphs and charts vector set
-
 Bar financial data graph. Forex stock crypto currency trading pattern.
-
 Blue growing successful business graph and businessmen
-
 Bar chart with graph
-
 Inflation background worldwide due to pandemic. Graph showing increase in inflation ,inflation wording and arrow line chart vector on red background
-
 World stock market index graph. Candlestick chart, line graph and bar chart. Stock market growth illustration. Financial market background. Blue color. Vector illustration
-
 Financial trade concept. Stock market and exchange. Candle stick graph chart.
-
 Business candle stick graph chart of stock market investment trading, Bullish point, Bearish point. trend of graph vector design.
-
 Pile of cash red recession graph with downward arrow illustration
-
 Stock market graph with uptrend view on a monitor for business investment illustration. Futuristic financial trading chart. Economic information growth background
-
 A luxury, gold graph for Stock market charts and forex trading graph in up trend concept for financial investment or Economic trends business idea, For down trend grapghs
-
 Abstract background of relative strength index (RSI) stock market chart graph on white background
-
 City background Financial graph on night city scape with tall buildings background double exposure. Economic growth graph chart. Vector illustration.
-
 Candle stick graph chart of stock market investment trading, Bullish point, Bearish point. trend of graph vector design.
-
 Descending graph concept, inverted yield curve. government bonds, investments, monetary funds. What is an inverted yield curve. Stressed businessman looking at bottom graph. flat vector illustration.
-
 Candle Stick Graph Chart Background Card. Vector
-
 Stock market investment trading graph or forex graph global network line wire frame data business concept for financial investment economic trends vector illustration
-
 Financial graph with coins. Vector.
-
 Economic and financial recession in the stock market. Lowering the interest rate. Chart on the monitor screen. Vector illustration
-
 Money loss. Cash with down arrow stocks graph, concept of financial crisis, market fall, bankruptcy. Vector stock illustration.
-
 Screen arrow graph down
-
 Stock market or forex trading graph in futuristic concept for financial investment or economic trends business idea. Financial trade concept. Stock market and exchange Candle stick graph chart vector.
-
 Bar graph and stock charts of investment trading in stock market. Statistics and report concept. Vector illustration in cartoon style.
-
 Increase interest rates. Businessman pulling up percentage icon. finance and investment vector
-
 Golden Business Graph
-
 Stock market investment trading graph in graphic concept suitable for financial investment or Economic trends business idea. Vector design.
-
 Stock market or forex trading graph in graphic concept for financial investment or economic trends business idea design. Worldwide finance background. Vector illustration.
-
 Forex stock chart. Data candle graph.
-
 Clean financial visualization showcasing stock market data using candlestick and line graphs. Perfect for presentations and financial analytics. Concept of economics, financial analytics, business
-
 Economic Crisis Graph
-
 Stock market charts and graphs
-
 World stock market index graph. Candlestick chart, line graph and bar chart. Stock market growth illustration. Financial market background. Dark Blue color. Vector illustration
-
 Increase value graph and money stock market value icon. on white background
-
 Roller coaster graph
-
 Short selling stock in stocks market sell high buy low trading strategy candle stick graph chart
-
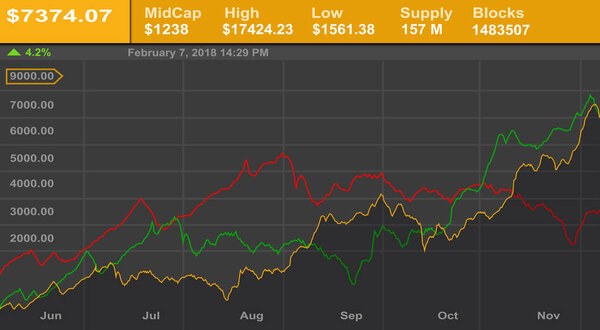 Business graph and stock diagram
-
 Red arrow pointing downwards showing crisis. Graph chart down icon. Realistic 3d vector illustration isolated on white background
-
 Economy finance crisis low investment graph arrow down background. money loss bankrupt decrease. vector illustration fantastic technology.
-
 Business graph trading of stock market investment on blue background. chart finance candlestick and arrow growth. economy trend rising to success. vector illustration fantastic design.
-
 Financial graph 2
-
 Mortgage rate icon. Cost of living. House. Interest rate. Property value. Vector icon isolated on white background.
-
 Bitcoin BTC hash rate has increase. Bitcoin symbol with green up arrow. Mining power has grown. Vector illustration.
-
 The graph shows the fall
-
 Financial graph
-
 World stock market index graph. Candlestick chart, line graph and bar chart. Glow light. Stock market growth illustration. Financial market background. Dark Blue color. Vector illustration
-
 Abstract background of blue average graph stock market index and world map
-
 Business graph and chart, concept of growth
-
 The stock market graph is in gold color for business investment illustration. Futuristic financial trading chart. Economic information growth background
-
 Graphs with arrows table.
-
 Abstract background of blue volume analysis or volume at price with market graph candlestick green red
-
 Flat design concept stock exchang and trader. Financial market business with graph chart analysis. Vector illustrations.
-
 Graph line chart financial statistic Infographics and diagnostics, charts and schemes vector. Business vector element
-
 Business graph bar chart
-
 Stock market investment trading technical analysis candlestick chart on white background. Business candle stick graph exchange trend. Trader financial investment index concept vector illustration
-
 Stock market investment trading technical analysis bar candlestick chart. Business exchange growing trend graph. Trader financial investment growth moving up index banner concept. Eps
-
 Exchange transfer rate. Businessman with a magnifying glass to view to percentage icon inside, up and down arrow. Vector illustration
-
 Stacks of golden coins and graph
-
 Money graph
-
 Business candle stick graph chart of stock market investment trading on blue background. Bullish point, up trend of graph. Economy vector design.
-
 Property interest, loan and real estate property investment concept with growing graph chart on dark blue background. Vector illustration.
-
 New York Stock Exchange market information recession graph in Businessman or trader holding hands on tablet computer. Concepts: Wall street, trading, economy financial crisis, online business magazine
-
 Return on Investment % per year concept with upward graph, one year financial growth. for savings program, annual profit and ROI Return on Investment Infographic. Flat design illustration.
-
 Big Data Statistics Background
-
 Charts vector set.
-
 Profit Arrow
-
 Vector infographic elements
-
 Venture business growth strategy, investment fund performance report, dynamic market data analytics, economy risk assessment
-
 Heartbeat vector rhythm with heart one line, a symbol of positive emotions, love and inspiration, happy Valentine day
-
 Forex stock market investment trading concept, Candlestick pattern with bullish and bearish is a style of financial chart.
-
 Retro infographics set. World Map and Information Graphics
-
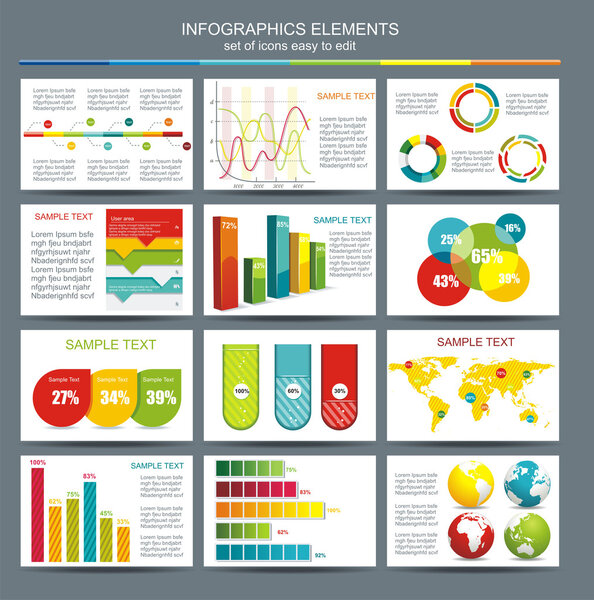 Detail infographic vector illustration. World Map and Informatio
-
 Business Infographic template
-
 Green Business Charts and Graphics Set. Vector
-
 Charts and Pie Diagrams with Numbers Information
-
 Personal & Business Finance Icons Set 3 - Blue Series
-
 World Map and Information Graphics. Vector
-
 Cartoon businessman group shocking down arrow and downturn econo
-
 Abstract green and red candlestick stock chart. Black background. Vector illustration.
-
 Candlestick stock exchange background vector. Forex green background with world currencies symbols
-
 Inflation concept. Money losing purchasing power with price level increase. Crisis of finance market. Vector isometric illustration of economy recession risk
-
 World financial crisis
-
 Trading candles charcoal
-
 Stock market with arrows
-
 Successful stock market statistical information and trends with up arrows. Futuristic financial trading chart. Economic information growth background
-
 Business growth concept
-
 Vector Statistic and Data, Infographic Background
-
 Stock market analysis
-
 Investment volatility Profit chart up and down arrows. Businessman trying to balance vector
-
 Lucky stock market investor
-
 Stock bull market concept background illustration
Each vector opens in a new tab with its details. Premium files are sold by Depositphotos; we may earn a commission if you buy. How this works.
