Progress graph data vectors
100 progress graph data vector illustrations picked from 5.7M royalty-free files, with no more than 3 per artist so you see real variety. Every file is a scalable EPS that opens in Illustrator, CorelDRAW, Affinity Designer and Inkscape, and exports to SVG or PNG at any size.
-
 Benchmarking analysis, analytics for best quality and financial progress. Tiny people measure graph unit with ruler, compare and check profit indicators on data performance cartoon vector illustration
-
 Chart, column graph, infographic element. Finance and economy with yellow vector.
-
 Graph up
-
 Bar Graph
-
 Vector Background with Graphs
-
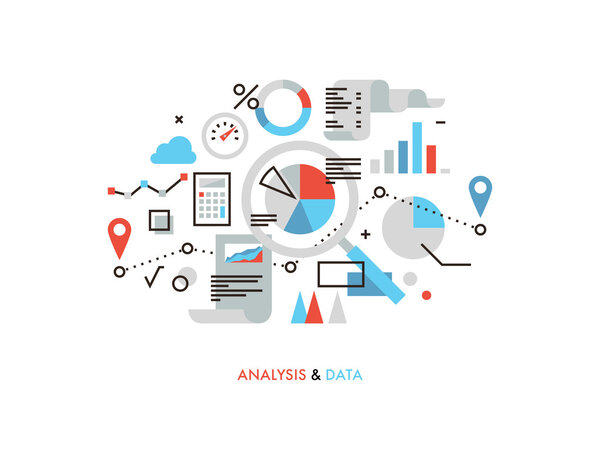 Data analysis flat line illustration
-
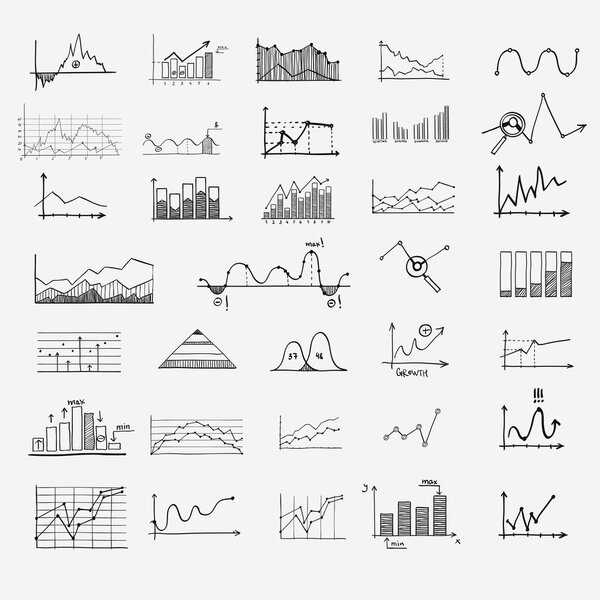 Business finance statistics infographics doodle hand drawn elements. Concept - graph, chart, arrows signs, search earnings money profit
-
 Business data market charts diagrams and graphs
-
 Creative vector illustration of business data financial charts. Finance diagram art design. Growing, falling market stock analysis graphics set. Concept graphic report element. Profit summary tools
-
 Vector cartoon line art icon of a bar graph with an upward-trending arrow isolated on a white background.
-
 Financial Graph Chart
-
 Business Graphs & Charts Icons - Blue Series
-
 Infographic flat design column graph
-
 Set of 3 business headers with various chart and graph. Data visualization concept for analysis, report, presentation, infographics. Vector illustration in 3d isometric style
-
 Vector landing page of Data analysis concept
-
 Fictitious Website Analytics Data
-
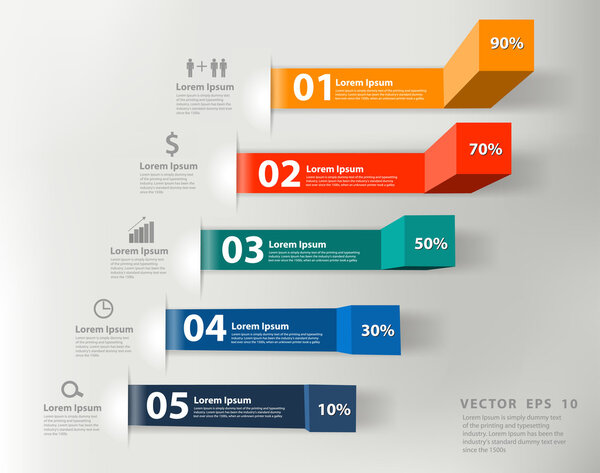 Modern business steps to success charts and graphs options banner
-
 Business intelligence platforms for progress monitoring tiny person concept. Information about profit, goals and objective development for effective company control and strategy vector illustration.
-
 Mobile and laptop Data analysis, research, planning, statistics, financial, infographic, management vector concept. Vector
-
 Graph displaying the forecast
-
 Rising graph simple web icon
-
 Business Data Flat Composition
-
 Develop business, increase sales or investment profit, growth and increase in company profits, increase in salary and income. businessmen trying to increase data traffic. flat cartoon illustration
-
 Sales, increase money growth icon, progress marketing. 3d vector illustration.
-
 Big data analysis, seo analytics, business graph statistics, business data review, financial research report, financial infographics flat vector illustration design for mobile and web graphics
-
 Vector template circle infographics. Business concept with 5 options, arrows and parts. Five steps for graph, diagrams, slideshow
-
 Vector infographics set. Collection of templates for cycle diagram, graph, presentation and round chart. Business concept with options, parts, steps or processes.
-
 Data Analytics Line Vector Icons 1
-
 Bar Chart Graph Diagram Financial Analytic Statistical Business Infographic Illustration
-
 3d illustration of business graph with arrow
-
 Bar graph vector icon linear icon.Line with Editable stroke
-
 Man with Increasing Graph or Chart on Tablet
-
 Vector circle arrows infographics set. Template for diagram, graph, presentation and chart. Business concept with 7 options, parts, steps or processes. Abstract background.
-
 Vector illustration concept of data analysis, statistics, business and workflow. Bar chart with tiny working people. Creative design for banner, poster, business presentation.
-
 Big Data
-
 Business graph and chart
-
 Growth graph with arrows in a circle. Vector business icon schedule cartoon style on white isolated background. Layers grouped for easy editing illustration. For your design.
-
 Graphs and charts vector set
-
 Graph and Diagram 2 line icon
-
 Business Graphs & Charts Icons - Colored Series
-
 Business statistics graph with multiple lines
-
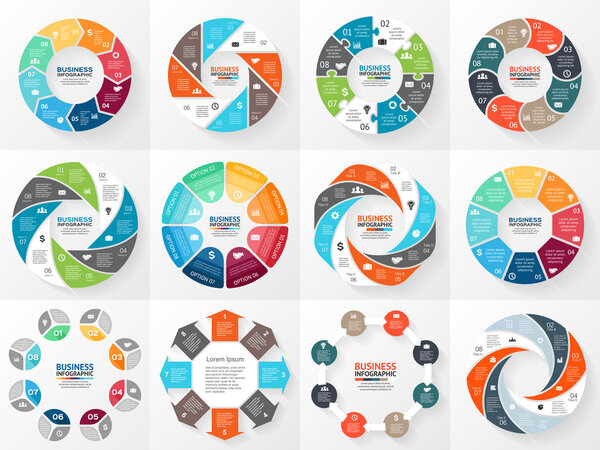 Vector circle arrows infographics set. Template for diagram, graph, presentation and chart. Business concept with 8 options, parts, steps or processes. Abstract background.
-
 Set of colored business graphs
-
 Line Graph Data Presentation Vector Illustration
-
 Vector growing graph chart background.
-
 3d business graph with red rising arrow
-
 Infographic dashboard template with flat design graphs and charts. Processing and analysis of data
-
 Calculator and business report with rising graph. Vector illustration.
-
 A digital representation of stock market performance with connected dots illustrating data points and trends
-
 Stock market investment trading graph concept background. Economic trends, forex and crypto graphic. Vector illustration. EPS 10.
-
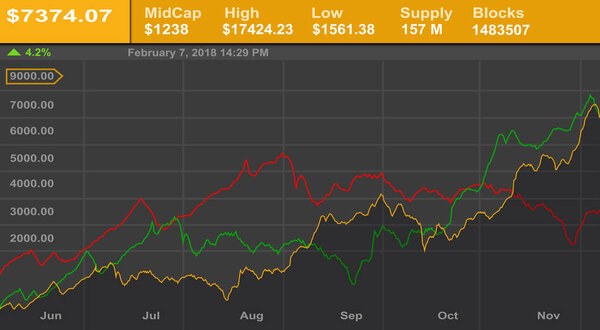 Business graph and stock diagram
-
 Infographic dashboard template with flat design graphs and charts
-
 Growth charts and graphs for business and companies
-
 Line graph presenting regression analysis, flat icon image
-
 Business investment trading stock growth on tablet. finance forex trade candlestick technology. Economy trends graph stock market statistics. vector illustration fantastic technology.
-
 Professional digital interface displaying environmental, social, and governance metrics with data visualizations and analytics.
-
 Line chart infographics, an abstract financial chart with an uptrend line graph and numbers in pink and green color for the stock market on white color background
-
 Set of Infographic dashboard template with charts, diagrams elements, online statistics and data analytics.
-
 Business finance money investment graph arrow up technology. Income and return on investment. trading stock market increase concept. vector illustration fantastic low poly wireframe design.
-
 A graph with a blue arrow pointing upwards is on a piece of paper. The graph is made up of three bars, with the middle one being the tallest
-
 Infographic template for DevOps vs agile for business and marketing goals code data diagram create a digital marketing strategy customized
-
 Abstract neutral business statistics chart growing graphs. Blue light glowing flat design. Finance economy diagram presentation template vector illustration.
-
 Business investment graph stock market to success. chart trading arrow up technology. income profit concept. vector illustration fantastic hi tech design.
-
 Growth chart and rising rocket cartoon design vector illustration.Increasing graph of sale forcast data on computer monitor on white background.Start up market profit flat concept design.
-
 Business strategy growth digital technology. Stock trading. Digital graph chart increase. Business on successful. Low poly diagram wireframe.
-
 Forex stock chart. Data candle graph.
-
 Concept of growth business on successful with graph icon up digital on dark blue background. growing graph icon from triangle line particle design low poly.
-
 Futuristic raise arrow with bar chart graph digital transformati
-
 Vector graph chart arrow for business strategy
-
 Checking data report - Flat minimal icon
-
 Rising bar graph Logo Icon. Business chart logo designs Template. Financial Data Growth Logo Design Vector Stock
-
 Economic inflation and tax with graph chart. Interest rate impact for stock investment and value recession. Financial and economic concept background. Vector illustration.
-
 Landing page concept flat isometric illustration. digital transformation analyst data monitoring
-
 Vector Statistic and Data, Infographic Background
-
 Business investment and graph arrow up growth on blue dark background. Business chart with rising and uptrend line graph.trading stock market concept.Vector illustration.
-
 Vector : Increasing business graph with grid on white background
-
 Young team of entrepreneurs engaged in business analysis on a large tablet. Data analysis concept. 3d isometric Concept for web design
-
 Downtrend arrow chart. Business Technological polygonal market Vector neon illustration. Low poly trend, data cash, finance concept. Connection lines, dots, wireframe mesh structure on blue background
-
 Graph chart of stock market investment trading. Monitoring finance profit and statistic. Abstract analisys and statistic diagram. vector illustration
-
 Candlestick trading graph, investing stocks market,buy and sell sign candlestick, vector illustration
-
 Graph with arrow and increase report. Diagram with the progress of rise and success. Vector illustration
-
 Stock market charts and graphs
-
 Blue-based infographics, graphs, charts and tables
-
 Graph line chart financial statistic Infographics and diagnostics, charts and schemes vector. Business vector element
-
 Charts graphs and parameters
-
 Abstract infographic visualization. Financial chart with uptrend line graphs and candlesticks. Futuristic network or business analytics. Graphic concept for your design.
-
 Illustration isometric concept. investment business analysis data
-
 Graph down
-
 Bar chart with graph
-
 Blue business chart graph with three lines of increase
-
 Shiny graph positive infographic
-
 Graph vector icon. Business infographic icon. Vector growing graph for business and finance. Growing graph line vector icon
-
 Market diagrams. Graphic information visualization and analysis. Statistical indicators and data
-
 Growing cash graph. Pile of cash, money value red rising graph arrow and financial growth diagram vector illustration
-
 Business Financial Graph Chart Diagram
-
 Financial growth and financial growth graph
-
 Icons of financial analytics, charts and graphs
-
 Colour business finance chart with data and arrows
-
 Abstract arrow growing up graph success blue vector background
-
 Business Failure and growth graphs
Each vector opens in a new tab with its details. Premium files are sold by Depositphotos; we may earn a commission if you buy. How this works.
