Progress chart data vectors
100 progress chart data vector illustrations picked from 5.5M royalty-free files, with no more than 3 per artist so you see real variety. Every file is a scalable EPS that opens in Illustrator, CorelDRAW, Affinity Designer and Inkscape, and exports to SVG or PNG at any size.
-
 Data analytics line icons. linear set. quality vector line set such as data security, flexibility, global research, progress chart, database storage, hierarchy, web analytics
-
 Business Graphs & Charts Icons - Blue Series
-
 Data Analytics Line Vector Icons 1
-
 Business charts
-
 Diagram graph Pie chart.
-
 Vector circle arrows infographic. Template for cycle diagram, graph, presentation and round chart. Business concept with 3, 4, 5, 6, 7, 8 options, parts, steps or processes. Big bundle includes 24
-
 Startup vector circle infographics with rocket launch and styled world map. 10 options, parts, steps, processes business concept for graphs, charts, diagrams.
-
 Data analysis flat line illustration
-
 Vector circle star infographic. Template for diagram, graph, presentation and chart. Business concept with 5 options, parts, steps or processes. Abstract background.
-
 Presenting a set of flat icons conceptualizing business data vectors. The vector icons in this set have vibrant and fun colors with editable quality. Happy downloading.
-
 Global pie chart statistics
-
 Vector graph bar chart. infographics. vector flat illustration
-
 Business Charts Vector Line Icons 3
-
 Vector social teamwork infographic. Template for circle diagram, graph, presentation and chart. Business concept with 3 options, parts, steps or processes. Abstract background.
-
 Data Analytics Vector Icons 3
-
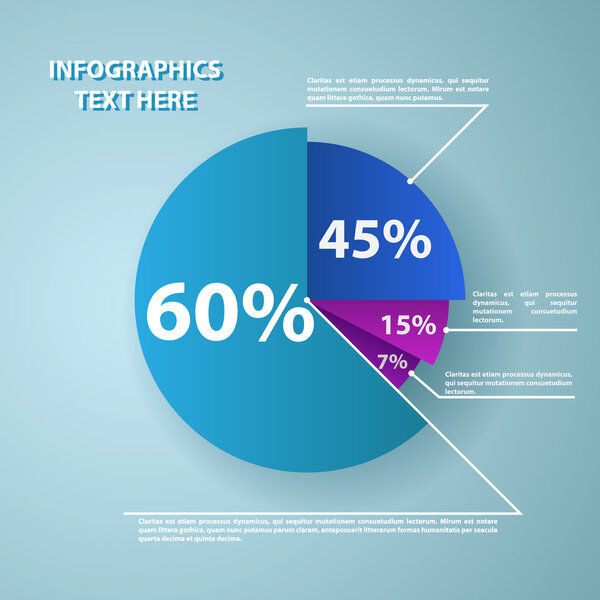 Business pie chart for documents and reports
-
 Business growth, risk management, productivity, innovation, data analysis, planning. Rocket launch, warning sign and bar chart with upward arrow. Business growth and risk management concept
-
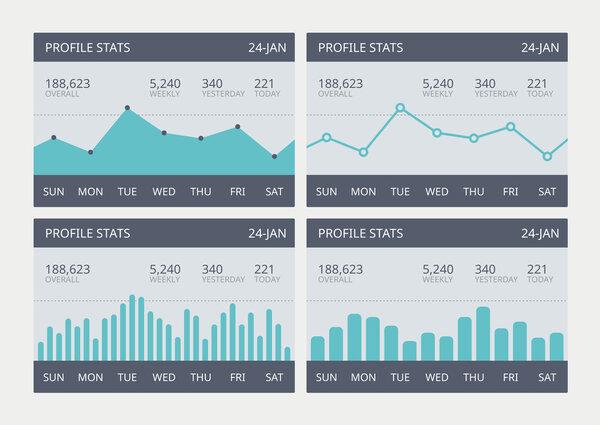 Vector business statistic charts set
-
 Abstract progress chart
-
 Progress chart statistic concept. Infographic vector template for presentation. Timeline statistical chart. Business flow process diagram.
-
 Forex stock chart. Data candle graph.
-
 Pie chart data communication in circle
-
 Thin line flat timeline infographic elements vector template. Can be used for workflow, business concept with 5 options, parts, steps or processes, number options, diagram, chart, data visualization.
-
 Business man hand shake with big smart phone shows analytics chart data pie financial information on screen.
-
 Data Analysis Line Icons Pack
-
 Upgrade, Update, And Progress Bar Icons Set.
-
 Set of various chart columns for infographics, vector illustration
-
 Simple People - Exponential Growth Chart
-
 Mobile and laptop Data analysis, research, planning, statistics, financial, infographic, management vector concept. Vector
-
 Bundle infographic elements data visualization vector design template. Can be used for steps, business processes, workflow, diagram, flowchart concept, timeline, marketing icons, info graphics.
-
 Bar Chart Graph Diagram Statistical Business Infographic Illustration
-
 Business Data Flat Composition
-
 Chart line concept, flat tiny businessman persons vector illustration
-
 Graph Chart icon
-
 Big data analysis, seo analytics, business graph statistics, business data review, financial research report, financial infographics flat vector illustration design for mobile and web graphics
-
 Vector colored numbered charts
-
 Set of info chart doodle
-
 Big Data
-
 Business couple with bar charts avatar character
-
 Data processing vector illustration. Tiny information work persons concept.
-
 Business data market charts diagrams and graphs
-
 Business Graphs & Charts Icons - Colored Series
-
 Data analysis concept
-
 Vector circle elements with arrows for infographic. Template for cycle diagram, graph, presentation and round chart. Business concept with 8 options, parts, steps or processes. Abstract background.
-
 Financial graphs and charts.
-
 Process Chart Template
-
 Info graphic vector set chart arrow steps collection elements
-
 Modern flat icons set of visual data charts, visualization template. Unique color flat graphics elements with stroke lines. Premium quality vector pictogram concept for web, logo, branding, infographics.
-
 Set of infographic options vector design template. Can be used for workflow layout, data visualization, business concept with 10 options, parts, steps or processes, banner, diagram, chart, web design.
-
 Growth chart low poly blue
-
 Business data market elements
-
 Business pie chart diagram data 5
-
 Pie charts and circular graph infographics set
-
 Vector circle infographic. Template for cycle diagram, graph, presentation and round chart. Business concept with 6 options, parts, steps or processes. Abstract background
-
 Infographic dashboard template with flat design graphs and charts. Processing and analysis of data
-
 A digital representation of stock market performance with connected dots illustrating data points and trends
-
 Abstract financial market stock chart. Black background. Vector illustration.
-
 Abstract green and red candlestick stock chart. Black background. Vector illustration.
-
 Infographic template for DevOps vs agile for business and marketing goals code data diagram create a digital marketing strategy customized
-
 Infographic dashboard template with flat design graphs and charts
-
 Growth charts and graphs for business and companies
-
 Professional digital interface displaying environmental, social, and governance metrics with data visualizations and analytics.
-
 Line chart infographics, an abstract financial chart with an uptrend line graph and numbers in pink and green color for the stock market on white color background
-
 Set of Infographic dashboard template with charts, diagrams elements, online statistics and data analytics.
-
 Stock market growth in futuristic technology style. Successful financial graphic on blue background. Business growth illustration with the bar chart static and up arrow.
-
 Abstract neutral business statistics chart growing graphs. Blue light glowing flat design. Finance economy diagram presentation template vector illustration.
-
 Business investment graph stock market to success. chart trading arrow up technology. income profit concept. vector illustration fantastic hi tech design.
-
 Growth chart and rising rocket cartoon design vector illustration.Increasing graph of sale forcast data on computer monitor on white background.Start up market profit flat concept design.
-
 Business strategy growth digital technology. Stock trading. Digital graph chart increase. Business on successful. Low poly diagram wireframe.
-
 Business graph growth digital marketing.rising stock chart on blue dark background. investment achievement successful. arrow income economy increase. vector illustration fantastic hi tech design.
-
 Futuristic raise arrow with bar chart graph digital transformati
-
 Technical analyze graphic with candlestick chart illustration. market volatility chart for stock trading, cryptocurrency background.
-
 Graphs and charts, focusing on data and performance trends
-
 Checking data report - Flat minimal icon
-
 Rising bar graph Logo Icon. Business chart logo designs Template. Financial Data Growth Logo Design Vector Stock
-
 Business growth chart vector icon
-
 Economic inflation and tax with graph chart. Interest rate impact for stock investment and value recession. Financial and economic concept background. Vector illustration.
-
 Business Infographics Chart
-
 Landing page concept flat isometric illustration. digital transformation analyst data monitoring
-
 Vector Statistic and Data, Infographic Background
-
 Business investment and graph arrow up growth on blue dark background. Business chart with rising and uptrend line graph.trading stock market concept.Vector illustration.
-
 Vector growing graph icon
-
 Vector circle element for infographic.
-
 Arrow growth graphic icon
-
 Colorful Bar Graph
-
 Cloud software for analytics and seo optimalization
-
 Diagram.
-
 Vector cartoon line art icon of a bar graph with an upward-trending arrow isolated on a white background.
-
 Vector illustration infographics seven options
-
 3d business growth bar graph
-
 Bar Graphs and Graphic Designs Flat Icons Pack
-
 Business graph
-
 Infographic brochure template, with colorful arrows and round pa
-
 Office Colored Vector Icons 2
-
 Pack of Shopping and Ecommerce Flat Icons
-
 Business project startup infographic with rocket template for cycle diagram
-
 Carefully curated 36 Heavy Line vector icons for Bar Graph, featuring 128x128 PIXEL perfect resolution for consistent brand representation and user experience.
-
 Male Office workers are studying the infographics, the analysis of the evolutionary scale. Vector illustration of business graphics, distance learning and education.
-
 A male technician managing server equipment using a crane and a large wrench, symbolizing IT infrastructure, engineering, and modern technology.
-
 Infographic steps concept in flat style
Each vector opens in a new tab with its details. Premium files are sold by Depositphotos; we may earn a commission if you buy. How this works.
