Plot line science system data vectors
53 plot line science system data vector illustrations picked from 128 royalty-free files, with no more than 3 per artist so you see real variety. Every file is a scalable EPS that opens in Illustrator, CorelDRAW, Affinity Designer and Inkscape, and exports to SVG or PNG at any size.
-
 Data analytics icons including mining, machine learning, decision making, database, business intelligent, science, bar, line graph, scatter plot, histogram, pie chart, box, pyramid, average, variability, random sampling, frequency table, cluster
-
 Cartesian coordinate system. vector illustration. template for drawing graphs of trigonometric functions
-
 Big data information streams network
-
 Abstract technology data visualization background. network futuristic wireframe. artificial intelligence. cyber security. visual information complexity. Intricate data threads plot.
-
 Cartesian coordinate system icon. Thin linear cartesian coordinate system outline icon isolated on white background from education collection. Line vector sign, symbol for web and mobile
-
 Cartesian coordinate system plane chart axis diagram white.
-
 Cloud signal server business investment management system
-
 Grid, Graph, Drawing, area, software Line icon with 5 steps pres
-
 Time, Dot plot and Unlock system line icons for website, printing. Collection of Organic tested, Sick man, Diagram graph icons. Cough, Data analysis, Web traffic web elements. Oil barrel. Vector
-
 Grid, Graph, Drawing, area, software Business Flat Line Filled
-
 Set line XYZ Coordinate system, Function mathematical symbol and Mathematics function cosine. Business infographic template. Vector
-
 Select user, Money diagram and Idea head icons set. Online statistics, Unlock system and Dot plot signs. Vector
-
 Cartesian coordinate system vector icon editable stroke outline icons for web and mobile
-
 Cartesian coordinate system vector icon in 6 different modern styles. Black, two colored cartesian coordinate system icons designed in filled, outline, line and stroke style. Vector illustration can
-
 Set line Mathematics function cosine, XYZ Coordinate system and Function mathematical symbol icon. Vector
-
 Cartesian coordinate system icon in filled, thin line, outline and stroke style. Vector illustration of two colored and black cartesian coordinate system vector icons designs can be used for mobile,
-
 Parabolic concept 2 colored icon. simple line element illustrati
-
 Grid, Graph, Drawing, area, software Bold and thin black line ic
-
 Gaussian function icon in filled, thin line, outline and stroke style. Vector illustration of two colored and black gaussian function vector icons designs can be used for mobile, ui, web
-
 Cartesian coordinate system outline vector icon. Thin line black cartesian coordinate system icon, flat vector simple element illustration from editable education concept isolated on white background
-
 AI Function Approximation icon. Vector thin line illustration on a round dark blue background. Symbolizes the process where an AI model approximates (smooth curves) an unknown function based on given data points (scatter plot)
-
 Collection of Diverse Outline Icons Representing Data Analysis and Workflow Visualization
-
 Icon of AI linear regression analysis with layered screens showing scattered dots and a diagonal line. Vector clipart with thin black lines on a transparent background, editable line thickness
-
 Overfitting and data pathfinding vector line icon. Wavy arrow moving through scatter plot points representing complex routing, algorithm error, and data trajectory
-
 Collection of Diverse Outline Business Data Visualization and Diagram Icons
-
 Graph showing curve with data points plotted
-
 Outline Simple Scatter Plot with Arrow Axis Graphic Element Icon
-
 A line graph with a person icon on the x-axis within a purple hexagon.
-
 Mathematics graph and hyperbola function icon in line design. Mathematics, graph, hyperbola, function, geometry, coordinate system, algebra on white background vector. Math editable stroke icon.
-
 Data analysis, educational tools, cloud computing, mathematical concepts, vector design, abstract ideas. Graph of a sine wave and minimalistic cloud art. Data analysis and cloud computing concepts
-
 A line graph showing a saturation curve with a purple gradient background.
-
 Graph shows correlation line and diagram on a white background
-
 Cartesian coordinate curve icon in line design. Curve, coordinates, graph, math, vertices, x axis, y axis on white background vector. Cartesian coordinate curve editable stroke icon
-
 Minimalist black sine wave graph on a white background. Mathematical function with axes, symbolizing oscillation, periodic motion, signal, physics, math education, and data visualization
-
 Mathematics graph and parabola function icon in line design. Mathematics, graph, parabola, function, geometry, coordinate system, algebra on white background vector. Math editable stroke icon.
-
 A scatter plot showing two distinct groups of data points separated by a diagonal line.
-
 Magenta neon linear function graph grid background black. Bright pink diagonal linear graph line coordinate grid axes black background retro futuristic HUD interface visual
-
 Cartesian coordinate system on a notebook sheet on a checkered grid. Vector illustration
-
 Cartesian coordinate system with two perpendicular axes. Graph with a horizontal x-axis and a vertical y-axis
-
 Cartesian coordinate system vector icon isolated on transparent background, Cartesian coordinate system logo design
-
 Cartesian coordinate system icon vector isolated on white backgr
-
 Gauss distribution. Standard normal distribution. Gaussian bell graph curve. Business and marketing concept. Math probability theory. Editable stroke. Vector illustration isolated on white background
-
 Blue control panel abstract Technology Interface hud on black background vector design.
-
 Normal Gauss distribution. Standard normal distribution. Gaussian bell graph curve. Vector illustration isolated on white background.
-
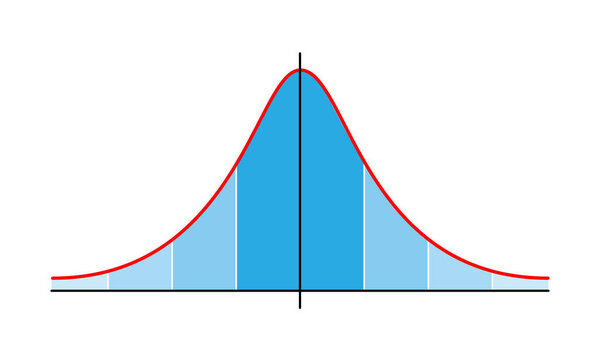 Gauss distribution. Standard normal distribution. Distribution standard gaussian chart. Bell curve symbol. Vector illustration isolated on white background.
-
 Gauss distribution. Distribution standard gaussian chart. Standard normal distribution. Bell curve symbol. Vector illustration. stock image. EPS 10.
-
 Gauss distribution. Math probability theory. Standard normal distribution. Gaussian bell graph curve. Business and marketing concept. Vector illustration. EPS 10. Stock image.
-
 Parabolic icon in different style vector illustration. two color
-
 Vector illustration of graph chart
-
 A graphic representation of a piecewise linear function with saturation on an orange circular background.
-
 3D graph visualization alongside bug warning sign and analytics chart for insights and error analysis. Ideal for technology, programming, troubleshooting, research, monitoring, problem-solving
-
 Gaussian function icon vector isolated on white background for your web and mobile app design, Gaussian function logo concept
-
 Gaussian function vector icon isolated on transparent background
Each vector opens in a new tab with its details. Premium files are sold by Depositphotos; we may earn a commission if you buy. How this works.