Performance chart vectors
100 performance chart vector illustrations picked from 18M royalty-free files, with no more than 3 per artist so you see real variety. Every file is a scalable EPS that opens in Illustrator, CorelDRAW, Affinity Designer and Inkscape, and exports to SVG or PNG at any size.
-
 Power performance chart line and solid icon. Energy graph, hexagon in coordinate symbol, outline style pictogram on white background. Benchmarking sign for mobile concept, web design. Vector graphics.
-
 Vector web site design template. Data center server monitoring system. Network and computer performance chart. Landing page concepts for website and mobile development. Modern flat illustration
-
 Simple icon of a bar chart with upward arrow symbolizing performance.
-
 Business Team Climb Chart. Businesspeople Holding Hands Going Up on Growth Chart Graph Diagram. Leader Set Up Flag on Top. Success Career Performance, Investment. Cartoon Flat Vector Illustration
-
 Financial Performance Analytics Dashboard Metrics KPI Revenue Growth CAC Reduction Trend Uptrend Chart Bars Data Visualization Reporting Strategy Green Gradient Vector Illustration.
-
 KPI key performance indicator. Vector illustration. KPIs serve as metaphor business goals and objectives A performance indicator chart cvisually represent progress Strategy measurement involves both
-
 Kpi line icon. Key performance indicator sign. Progress and success targets symbol. Illustration for web and mobile app. Line business performance indicator icon. Editable stroke Kpi chart. Vector
-
 Sales tracking report ui dashboard chart set. Team performance, teamwork. Financial metrics, accounting. Pitch deck. Graph layout presentation slides. Data visualization. Montserrat font used
-
 KPI. Businessman standing next to a chart of key performance indicators
-
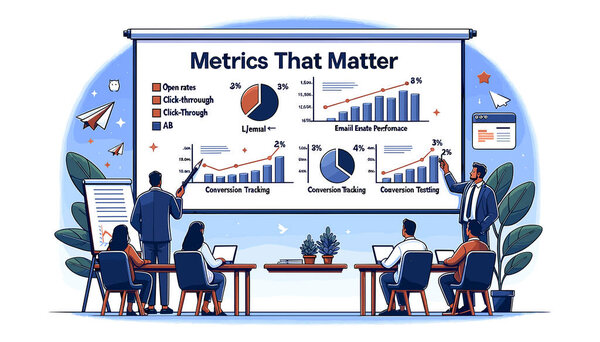 The slide is titled 'Metrics that Matter'. It displays business analysts reviewing charts and graphs related to email performance
-
 Exponential growing curve above a bar chart shaded with hand drawing strokes in black and white. Illustration as design element for the topics of business, sale performance, profit and revenue
-
 Clean and modern business presentation slides with editable metrics, charts and illustrations. Ideal for startups, analytics reports, fintech presentations and performance reviews. Vector
-
 Sales performance concept for presentation slide template. People analyze financial data, business analytics and income growth, work with charts and graphs. Vector illustration for layout design
-
 Analytical dashboard featuring graphs, pie chart, bar chart, performance metrics, checklist, and gear icon. Ideal for data analysis, business growth, project management financial reports
-
 Businessman holding a magnifying glass, analyzing data charts on a dashboard. Ideal for business analysis, data visualization, performance metrics, strategic planning, financial reports, market
-
 Professional digital interface displaying quarterly acquisition metrics, revenue charts, and marketing campaign performance data.
-
 Business pie chart for documents and reports for documents
-
 KPI key performance indicator. Vector illustration. Financial metrics provide snapshot of business health Management often focuses on optimization of performance indicators Statistics are key
-
 Financial Report Icon Graph Chart Vector Pack
-
 Business Charts Icon Pattern Background
-
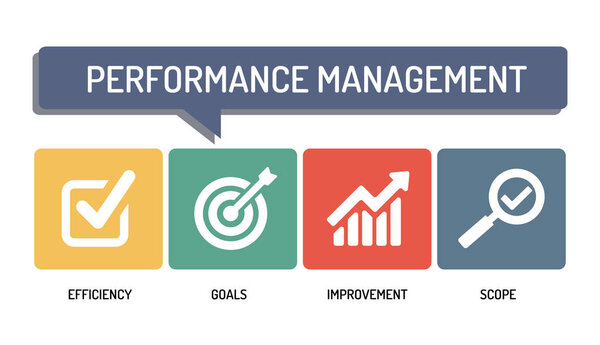 PERFORMANCE MANAGEMENT - ICON SET
-
 Business analytics concept. Business analytics with bar charts and upward trends data growth. Business analytics used in finance, marketing, management, and decision-making
-
 Business Charts Seamless Icon Pattern Background
-
 Corporate HR and Employee Lifecycle Icons. Includes Hiring, Performance, Pay, Training, and Structure in Stroke Vector Style.
-
 KPI or key performance indicator infographic template with cycle circular big circle dotted line arrow with dark background style with 3 point for slide presentation vector
-
 Business pie chart
-
 Bar Chart blue gradient vector icon
-
 Business performance presentation
-
 Bar Chart Flat four color minimal icon set
-
 Business pie chart for documents and reports for documents, reports, graph, infographic, business plan, education
-
 Financial administration concept. Consulting for company performance, analysis concept. Statistics and business statement. Flat isometric infographics for banner or business hero images.
-
 Website speed optimisation - Laptop with webpage and analytic tools on screen. Rocket flying up symbolising fast launch. SEOm performance and web development concept. Vector illustration.
-
 Diagram graph Pie chart. Presentation billboard.
-
 Businessman pulling a falling arrow graph chart from further dropping down.
-
 Businessman pulling arrow graph chart up with a rope.
-
 Vector circle infographic set. Business diagrams, arrows graphs, startup logo presentations, idea charts. Data options, 4 parts, steps, processes. Heart, bulb, head, rocket, medical plus.
-
 Infographic dashboard template with flat design graphs and charts. Processing and analysis of data
-
 Performance Line Icon
-
 Financial Chart Symbol Sign Package
-
 Business graph and chart
-
 Bar Chart silver plated metallic icon
-
 KPI - Key Performance Indicator mind map flowchart, business concept for presentations and reports
-
 KPI tracking, assessing metrics analysis concept vector illustration. Business analyst monitoring key performance indicators on dashboard
-
 Statistical chart outline vector icon. Thin line black statistical chart icon, flat vector simple element illustration from editable business concept isolated stroke on white background
-
 Growing bars graphic with rising arrow. Growing graph icon in black. Bar chart. Infographic. Vector on isolated transparent background. EPS 10.
-
 Professional data visualization interface showing sales metrics, revenue growth, and regional distribution performance analytics.
-
 KPI or key performance indicator infographic template with cycle circular big circle and arrow line with dark background style with 3 point for slide presentation vector
-
 Infographic dashboard template with flat design graphs and pie charts Online statistics and data Analytics. Information Graphics elements for UI UX design. Modern style web elements.
-
 Business Chart
-
 Concept of increasing income or salary, growth of investment profit or income from stock market, growth of money or wages, businessman with magnifying glass on dollar sign with growth charts and graphs.
-
 KPI or key performance indicator infographic template with thick outline circle like piechart shape with dark background style with 3 point for slide presentation vector
-
 Set of Infographic dashboard template with charts, diagrams elements, online statistics and data analytics.
-
 KPI or key performance indicator outlined measurement vector illustration.
-
 Profit performance graph
-
 Key performance indicator illustration design concept. Illustration for websites, landing pages, mobile applications, posters and banners
-
 Infographic dashboard template with flat design graphs and charts
-
 Dashboard User Admin Panel, Infographics Dashboard with flat design graphs and charts. Vector Illustration
-
 Key performance indicator banner with icons. Performance, measurement, efficiency, quality, growth, implementation, strategy, objective icons. KPI Business Internet Technology Concept. Web vector infographic in 3D style
-
 Growth chart icon. Statistical data graphic. Upward trend illustration. Vector concept. EPS 10.
-
 Analytics dashboard. Business statistics charts, financial graphs and data visualization widgets with bar chart, line graph, progress bars, speedometer gauge and world map trends analysis vector set.
-
 Sales performance modern flat concept for web banner design. Man analyzes company financial data and makes presentation, accountancy and management. Vector illustration with isolated people scene
-
 Types of benchmarking circular diagram infographic. Comparing company processes to competitors. Data visualization with 5 options. Hierarchy chart round. Montserrat SemiBold, Lato Regular fonts used
-
 Infographic dashboard mockups with pie charts, information, diagrams and graphs. Presentation slides online statistics and data analytics. Template gradient UI, UX, info panels. Vector graphics set
-
 Business Infographics Chart
-
 Chart of business data growth graph
-
 Set vector chart graph positive, negative infographic
-
 Modern infographic layout template for startups and businesses. Modular business infographic cards, mix and match layouts. Perfect for pitch decks, reports, social media posts, and performance presentations. Fully editable blocks for metrics, growth,
-
 KPI - Key Performance Indicators Icon set with Evaluation, Growth, & Strategy, etc
-
 Agile Sprint Burndown Chart Tracking Work Remaining for Scrum Teams
-
 Gap analysis as current and desired performance level outline diagram concept
-
 KPI - Key Performance Indicators Icon w Various Colors
-
 Vector infographics set. 20 best sellers of 2018. Business diagrams, arrows graphs, startup presentations and idea charts.
-
 Vision infographics with charts and statistics
-
 Diagram graph Pie chart.
-
 A digital representation of stock market performance with connected dots illustrating data points and trends
-
 Stock chart
-
 Admin dashboard UI, UX, GUI great design for any site purposes. Business infographic template. Concept user admin panel template design. Modern analytics with flat design graphs and charts. Vector
-
 Data analytics representation. Vector laptop with charts and graphs, dashboards and numerical indicators. Dataset flow, processing algorithms and metrics. Financial analysis and AI driven decision
-
 Modern modern infographic vector template with statistics graphs and finance chart
-
 Return on investment ROI concept. business growth arrows to success. dollar stack pile coins and money bag. chart increase profit. Finance stretching rising up. banner flat style vector illustration
-
 Ascendant bars graphic icon with rising arrow. Histogram icon in black. Infographic. Chart icon. Upward graph arrow chart vector flat, grow, gain, improvement, bar, diagram.
-
 Performance analysis. Market research group, research, statistic, information exchange, calculations.
-
 Financial graphic performance statistic income report business vector flat illustration
-
 Business graph and chart. Successful concept. Vector illustration
-
 Simple visualised profit increasing icon symbol with a chart and a rising curve.
-
 Revenue increase, investment portfolio growth, financial performance report, income improvement strategy, interest rate
-
 3D Financial report chart, SEO Optimization, web analytics and seo marketing concept. Business strategy. Landing page template. 3d rendering. Vector illustration
-
 Colorful Bar Graph
-
 Business diagrams infographics set
-
 Business management concept, Interaction hands using mobile apps
-
 Business and Finance Vector Line Icons 5
-
 Normal symbol
-
 Pack of Business Flat Icon
-
 Requests soft blue concept icon. Network information technology. It infrastructure. Round shape line illustration. Abstract idea. Graphic design. Easy to use in infographic, presentation
-
 Speedometer icon or sign with arrow. Vector illustration.
-
 Economic image of stock etc.
-
 Dashboard line icons, signs, vector set, outline illustration concept
-
 Coaching Business Icon Flat
-
 Business Template
-
 Financial data management concept banner header.
Each vector opens in a new tab with its details. Premium files are sold by Depositphotos; we may earn a commission if you buy. How this works.