Indicators vectors
100 indicators vector illustrations picked from 23.8M royalty-free files, with no more than 3 per artist so you see real variety. Every file is a scalable EPS that opens in Illustrator, CorelDRAW, Affinity Designer and Inkscape, and exports to SVG or PNG at any size.
-
 Kpi key performance indicator business concept evaluation strategy plan measure hr
-
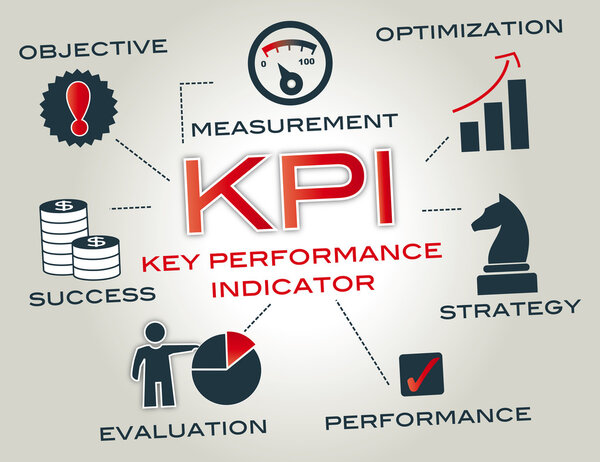 Key Performance Indicator
-
 Set of indicator rating. Level of happiness. Colored speedometrs isolated on white background.
-
 KPI, key performance indicators. Concept table with keywords, letters and icons. Colored flat vector illustration on white background.
-
 Symbolical image of lifting of economic indicators.
-
 Growth charts indicators with reflection on a light blue background
-
 Credit score indicators with color levels from poor to good. Credit score meter set. Vector illustration.
-
 Finance indicators, statistical data, marks of finance position, marketing research.
-
 Price patterns indicator for analysis bull bear stock market forex for sell and buy signal
-
 Kpi key performance indicator infographic 3 point stage template with half circle shape outline with badge for slide presentation vector
-
 Kpi key performance indicator infographic 3 point stage template with circle and wings shape dot connection for slide presentation vector
-
 Swing trading vs. day trading, a diagram contrasting timeframes and strategies. Key objects, charts, buy-sell indicators. Neubrutalism style diagram.
-
 Growth indicators schedule
-
 Kpi line icon. Key performance indicator sign. Progress and success targets symbol. Illustration for web and mobile app. Line business performance indicator icon. Editable stroke Kpi chart. Vector
-
 Modern template infographics design data presentation indicators
-
 Scoring indicators. Goods gauge speedometers, rating meter indicators. Credit score manometers, loan history graphs. Vector set
-
 KPI key performance indicator model infographic concept for slide presentation with big outline circle horizontal right direction with 3 point list with flat style vector
-
 Credit limit indicators with color levels from poor to good.
-
 KPI - Key Performance Indicators Icon set with Evaluation, Growth, & Strategy, etc
-
 Template data presentation indicators
-
 KPI - Key Performance Indicators Icon w Various Colors
-
 Charts key server statistic, performance indicators concept. Analyst on management process. analytics dashboard. Virtual screen showing sales concept. Characters on flat isometric Vector illustration.
-
 KPI w Key Performance Indicators Web Header Banner and Icon set
-
 Dashboard service abstract concept vector illustration. Online reporting mechanism, key performance indicators, dashboard service tool, data metrics, information management abstract metaphor.
-
 Kpi key performance indicator infographic 3 point stage template with big circle piechart on right column for slide presentation vector
-
 SEO performance illustration set internet indicator speed background of search machine chart on monitor display computer globe man profile in bubble chat with flat style
-
 Candlestick indicator for stock market forex for sell and buy signal icon
-
 Credit score indicators. Level indicator. Speedometer goods gauge rating meter. Vector illustration
-
 Percent Indicator Pie Chart
-
 Statistics big data, analytical indicator sci-fi background
-
 Progress indicators
-
 Report with key performance indicators kpi icon sign vector
-
 Graph paper with indicators and scale growth.
-
 Credit indicators digital
-
 Vector speedometer meter with arrow for dashboard with green, yellow, orange and red indicators. Gauge of tachometer. Low, medium, high and risk levels. Bitcoin fear and greed index cryptocurrency.
-
 Indicators collection
-
 Vector color speedometer meter with arrow for dashboard with green, yellow, orange and red indicators. Gauge of tachometer. Low, medium, high and risk levels. Bitcoin fear and greed index
-
 Abstract background of Stock Market and EMA ema crossover golden cross and death cross indicator technical analysis graph
-
 Scale. Gauge. Meter. Indicators with different indicators.
-
 Map indicators set
-
 Red down arrow, green up arrow. Directional indicators. Vector illustration. EPS 10.
-
 Business development.
-
 Countless colorful particles form a rainbow-shaped arrow, symbolizing rise and development, vector graphics.
-
 Businessman with telescope looking to the future.
-
 Analysis and Financial Management.
-
 3d illustration concept: KPI
-
 Stand with Charts and Parameters
-
 Dashboard service abstract concept vector illustration.
-
 Conceptual vector icon of KPI
-
 Infographics vector design template
-
 Vector infographic dashboard design graphs business analytics
-
 Progress Tracking icon, progress monitoring, progress assessment, progress evaluation, progress measurement lineal color icon, editable vector icon, pixel perfect, illustrator ai file
-
 Candlestick trading graph isolated on png or transparent background, investing stocks market,buy and sell sign candlestick, vector illustration
-
 Vector stock charts and market analysis in blue theme.
-
 A frustrated businessman holding a dollar coin stands on a downward percentage arrow, illustrating the decline in dollar valuation.
-
 Financial Performance Analytics Dashboard Metrics KPI Revenue Growth CAC Reduction Trend Uptrend Chart Bars Data Visualization Reporting Strategy Green Gradient Vector Illustration.
-
 A businessman holding a telescope, standing atop a graph showing an upward trend, Illustration Concept of Monitoring a business's progress as profits and company value rise
-
 Illustration of financial growth, business deals, and stock market trends in neubrutalism style collection.
-
 Digital business analytics concept, data threads graphic visualization
-
 A glowing blue bar graph with arrows pointing upwards on a dark blue background, indicating growth and success in business and finance.
-
 Data analysis dashboard with various charts including line graph, pie chart, and bar graph displayed on computer screens. Ideal for business analytics, presentations, reports, data visualization
-
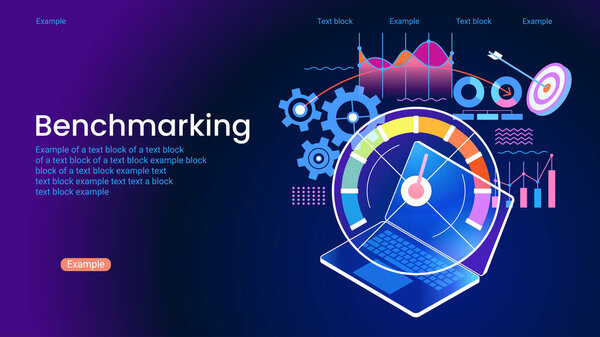 Benchmarking concept. Analysis of the effective functioning of the business. The idea of development and improvement of business. Business risk testing. Evaluation of possible ways to improve the business.
-
 Graph up and down arrows, profit and loss concept
-
 Outline icons set representing data quality concepts like accuracy, consistency, completeness, timeliness, and reliability.
-
 A bar chart with a growth arrow representing financial analysis, business development, performance metrics, and success in a digital and economic context.
-
 Round Flat Analytics Icon, Graph with Different Columns, negative graph, Business Graphics vector illustration. Two versions of icons
-
 A digital dashboard with line and bar charts, data points, and interface elements. Ideal for data analysis, presentations, business reports, finance, and research. Minimalist flat vector style.
-
 Strategic bundle featuring 24 vector icons representing Kpi in SolidFill format, optimized with 128x128 PIXEL perfect quality for professional workflows.
-
 KPI icon. Simple element illustration. KPI concept symbol design. Can be used for web
-
 Forex gap vector illustration. Gap between open and close prices of stock market.
-
 Construction site crane KPI text
-
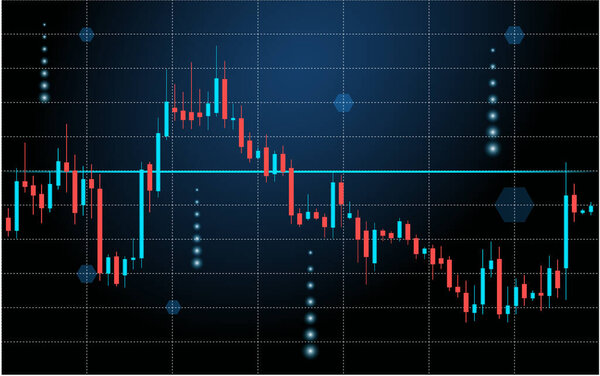 Dashboard grfico de las estadsticas de divisas, negocios y anlisis financiero, la tasa de beneficios y costes, ilustracin vectorial
-
 Vector Set of 16 Modern Thin Line Icons Related to Strategy Management System and Balanced Scorecard. Simple mono line pictograms and infographics design symbols - part 1
-
 Set of illustrations concept with businessmen. Workflow, growth, graphics. Business development, milestones. linear illustration Icons infographics. Landing page site print poster. Line story
-
 Hand points graphic representation
-
 Scale of ph value for acid and alkaline solutions, infographic acid-base balance. scale for chemical analysis acid base. vector illustration isolated or white background
-
 Infographic sheet
-
 Dashboard vector icon isolated on transparent background, Dashbo
-
 Modern flat design concept of Business Analytics with decorated small people character for website and mobile website development. UI and UX design. Landing page template. Vector illustration.
-
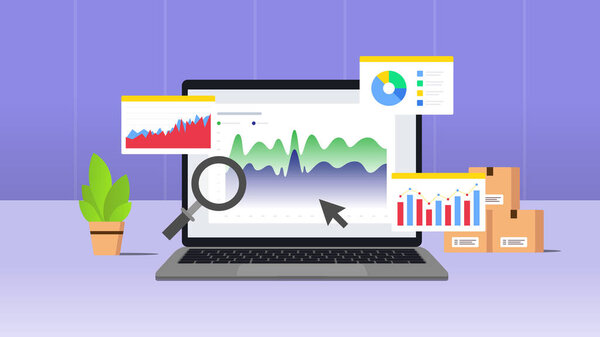 E Commerce Market Performance Illustration concept. Statistical and Data analysis for business finance investment concept. Vector illustration with purple background
-
 A businessman standing on a trophy, charting an upward trend in his business, illustration concept of Correlation between business growth and development with achievements attained
-
 Performance chart illustration
-
 Financial statistics analysis concept on smartphone and laptop with diagrams or flowgraph, trend, marketing analysis and business planning, report chart on top views of computer. Vector
-
 Business strategy and financial performance banner
-
 A male doctor is standing back
-
 Buy signal candle stick
-
 Economic and mathematical brochure, business concept, presentati
-
 Data pattern of cyclical processes
-
 Strategic Business Development Consultant. Concept top manager woman improves financial performance on chart. Success and goal achievement.
-
 Economic crisis elements. financial crisis. investment graph dow
-
 Pregress and uploading bar set. Vector illustration.
-
 Flat arrows with data infographics template
-
 Matrix Vector. White Particle Background. Blue
-
 Colorful Milestone Roadmap Infographic with Arrow and Six Steps, Vector Illustration
-
 Car speedometer
-
 The physician doctor and the nurses
-
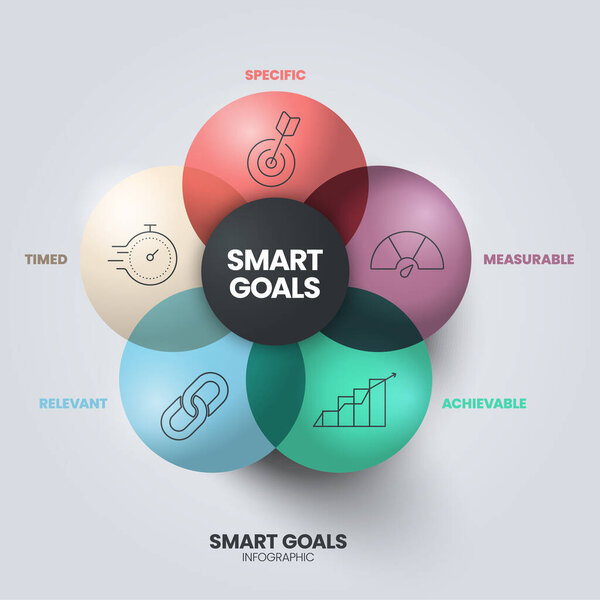 Smart Goals diagram infographic template with icons for presentation has specific, measurable, achievable, relevant and timed. Simple modern business vector. Personal goal setting and strategy system.
-
 Cartoon vector illustration of business and education concept. Business woman climbing the career ladder.
-
 Businesspeople searching market place. Data analysis,planing International trade, global trading networks Modern flat illustration
-
 Digital dashboard showcasing speed and engine data with clear gauges for easy vehicle monitoring.
Each vector opens in a new tab with its details. Premium files are sold by Depositphotos; we may earn a commission if you buy. How this works.