Index data analysis vectors
100 index data analysis vector illustrations picked from 6.8M royalty-free files, with no more than 3 per artist so you see real variety. Every file is a scalable EPS that opens in Illustrator, CorelDRAW, Affinity Designer and Inkscape, and exports to SVG or PNG at any size.
-
 Data analysis bundle of isometric elements. Growing chart, business infographics, research tools, analytic data, financial index isolated icons. Isometric vector illustration kit with people character
-
 Analysis symbol with magnifying glass
-
 Business Analysis symbol with magnifying glass icon and pie chart.
-
 Creative vector illustration of business data financial charts. Finance diagram art design. Growing, falling market stock analysis graphics set. Concept graphic report element. Profit summary tools
-
 Infographic concept. Call center, Report and Car leasing icons simple set. Data analysis, Dollar exchange and Heart signs. Travel loan, Loan percent and Credit card symbols. 2019 year. Vector
-
 Magnifying glass data analysis flat
-
 Call center, Report and Car leasing icons set. Data analysis, Dollar exchange and Heart signs. Vector
-
 Data analysis, seo analytics, business data review, business graph statistics, financial research report, financial infographics flat vector illustration design for mobile and web graphics
-
 Business Data Analysis Teamwork Strategy Growth
-
 Statistics Data Analysis Flat Vector Web Banner
-
 The process of searching data in a folder with a magnifying glass
-
 Search web icons in line style. SEO analytics, Digital marketing data analysis, Employee Management. Vector illustration.
-
 Business Data Analysis Flat Vector Web Banner
-
 Data analytics and statistics analysis line icon. Company business data analytics outline icon, finance strategy presentation or database infographics linear vector symbol with graphs
-
 Tiny Business Characters with Huge Golden Coin near Grow Chart. Investment Strategy and Portfolio Analysis, Investment
-
 Business Analysis symbol with magnifying glass icon
-
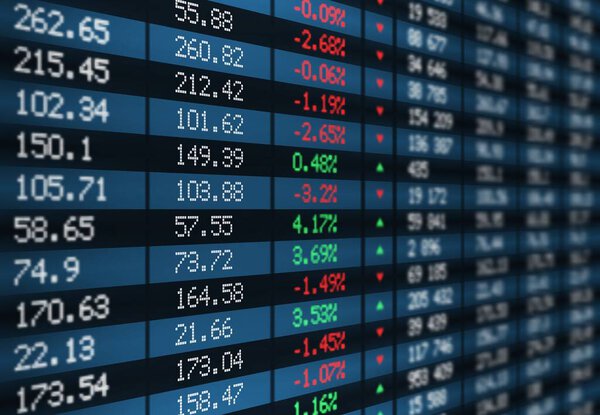 Stock exchange board vector display with financial market index charts and graphs. Stock market ticker screen with green and red numbers of share volume, price traded, change direction, economy themes
-
 Stock market graph or forex trading chart for business and financial concepts. Stock market data. Bullish point, Trend of graph. Vector illustration
-
 Illustration of financial chart of growing and falling market. Blue display of trend index on white background - vector
-
 Stock market investment trading graph or forex graph global network line wire frame data business concept for financial investment economic trends vector illustration
-
 Isometric file in database, document flow management concept. Cloud data storage and remote data access
-
 Technical Analysis Of Exchange Trade, stock market or stock exchange vector illustration
-
 Crypto market candlestick chart on dark background. red-green candlesticks with upside arrow indicate. analysis, investment, trading, cryptocurrency, business finance
-
 Stock exchange board with market index, vector graphs and charts. Stock market ticker display or screen indicators with financial trade prices, share volume and change direction, finance and business
-
 Business candle stick graph chart of stock market investment trading with world map. Stock market and exchange. Stock market data. Trend of graph. Vector illustration for your design
-
 Stock market investment trading illustration concept. Financial bar chart, yield curves, bond data, and upward-sloping graph on a white background. Business candlestick trend graph
-
 Stock market analysis
-
 Vector illustration. Flat background. Market trade. Trading platform ,account. Moneymaking,business. Analysis. Investing.
-
 World stock market index graph. Candlestick chart, line graph and bar chart. Stock market growth illustration. Financial market background. Blue color. Vector illustration
-
 World stock market index graph. Candlestick chart, line graph and bar chart. Glow light. Stock market growth illustration. Financial market background. Dark Blue color. Vector illustration
-
 World stock market index graph. Candlestick chart, line graph and bar chart. Stock market growth illustration. Financial market background. Dark Blue color. Vector illustration
-
 Stock market and exchange. Candle stick graph chart of stock market investment trading. Stock market data. Bullish point, Trend of graph. Vector illustration.
-
 Illustration of blue growth index or graph. Investment or stock
-
 Bar financial data graph. Forex stock crypto currency trade pattern triangle.
-
 Horizontal banner stock market or forex trading platform. Dashboard with online trading, investment, market monitoring and analysis and real-time data. Banner stock exchange and binary option. Vector
-
 Financial data graph chart on grey background. Business background with candlesticks chart for reports and investment. Financial market trade concept.
-
 Laptop trading chart on screen in 3D cartoon realistic style. Candle stick diagram cryptocurrency market analysis. Financial management and investment concept. Vector illustration
-
 Stock market trading technical analysis bar chart fall. Business exchange candlestick graph downtrend. Crisis economy and investment loss graph. Trader financial index crash banner. Black background
-
 Isometric Investing and Stock Market Gain and Profits with Red and Green Candlestick Charts. Stock Exchange Market Graph, Analysis UI, UX on Laptop. Binary Option. App Screen for Trading
-
 Black laptop with candlestick chart on screen and 3D pie diagram. Stock market analysis and success business investment. Render laptop with online trading app. Vector
-
 Business data analytics. Financial graph chart. Graph chart of stock market investment trading. Abstract analisys and statistic diagram. vector illustration
-
 Illustration of blue financial chart with increasing tendency. Market and stock index - vector
-
 Falling stock chart with a world map at the bottom indicates an economic recession, market volatility or financial crisis. Suitable for use in economic news, analysis reports, and global finance.
-
 A chart of stock market crypto candlesticks on a dark background. Analysis of investment trading in the field of cryptocurrencies, stocks and forex. Vector illustration
-
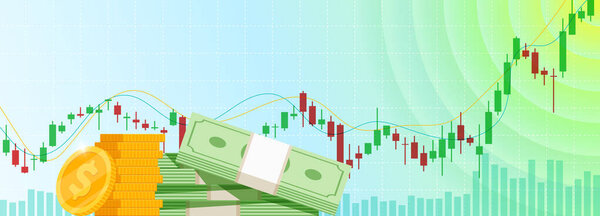 Stock market trading technical analysis bar growing candlestick chart. Business exchange bullish trend graph. Trader financial investment growth moving up index eps banner. Savings and income concept
-
 Flat design concept stock exchang and trader. Financial market business with graph chart analysis. Vector illustrations.
-
 Stock market investment trading technical analysis bar candlestick chart. Business exchange growing trend graph. Trader financial investment growth moving up index banner concept. Eps
-
 Financial graph and stock market up and down. business investment to success. trading data chart strategy. market profit money. vector illustration hi-tech.
-
 Market trade. Binary option. Trading platform, account. Press Put and Lost transaction. Money Making, business. Market analysis. Investing. Screen of user interface for phone, laptop, tablet
-
 Candlestick treading index on computer monitor
-
 Analysis Stock Exchange Rates on Monitors
-
 Business Analysis, Stock Trading Symbol - Chart, Diagram on the Screen of a Laptop Computer and Mobile Phone
-
 Big data algorithms visualization technologies infographic analy
-
 Abstract background of relative strength index (RSI) stock market chart graph on white background
-
 Investment report with various infographics. Data visualization, commercial business analytics, financial graph, stock index cartogram vector illustration. Corporate business presentation template.
-
 Vector Business graph with arrow showing profits and gains Abstract of financial stock data Stock
-
 Abstract background of blue volume analysis or volume at price with market graph candlestick green red
-
 Digital business analytics concept, data threads graphic visualization
-
 Digital analytics concept, data visualization, financial schedule, vector
-
 Business analytics isometric GUI design kit. Business planning, financial analysis templates for mobile app. Market research UI UX onboarding screens. Vector illustration with tiny people characters.
-
 Analytics landing page with people characters. Business indicators analysis banner. Financial statements, market reserch vector illustration. Flat concept great for social media promotional materials.
-
 Financial analytics, stock market trades and exchange analysis in mobile app. Tiny people analyze online data reports and graphs on dashboard of smartphone screen cartoon vector illustration
-
 Investment Portfolio Analysis and Asset Management Banner concept illustration
-
 Data monitoring and analysis on desktop vector illustration. Cartoon tiny people with magnifying glass research graphs, charts and diagram on laptop screen, monitor financial report growth for trade
-
 Graph of Cryptocurrency market. Finance business data concept. Stock market graph on the screen. Background stock chart. Stock market graph and bar chart price display.
-
 Abstract futuristic technology background of fundamental analysis vs technical analysis stock market Price Chart
-
 Market trade. Binary option. Trading platform, account. Press Call and Win transaction. Money Making, business. Market analysis. Investing. Screen of user interface for phone, laptop, tablet
-
 Financial stock market concept, vector illustration. Exchange trader desk, people monitoring, forecasting financial indexes data online.
-
 Business Analysis symbol with magnifying glass line icon and pie chart.
-
 Stock market bar graph, candlestick chart, finance trade data.
-
 Statistic diagram chart colorful. diagram chart graph elements vector business infographic diagram data template. colourful diagram and chart icons.
-
 A Virtual Growth bar charts Financial Graph On Digital Technology Strategy Background With Finance Data Marketing Chart Analysis Report Or Success Investment
-
 A man at a computer monitors stock indexes. Vector illustration on the topic of trading.
-
 Business Analysis symbol with magnifying glass icon and chart.
-
 Market analysis and business information research outline hands concept. Analyzing statistics, competitor sales results or targeted strategy for best customer satisfaction results vector illustration
-
 Chart pie under the magnifying glass
-
 Financial Graph Chart
-
 Ambiguity icons set line color vector
-
 Line Search Icons
-
 Stock exchange rates on monitors
-
 Stock market or forex trading graph. Chart in financial market vector illustration Abstract finance background
-
 Financial stock market graph on stock market investment trading, Bullish point, Bearish point. trend of graph for business idea and all art work design. vector illustration
-
 Technical analyze graphic with candlestick chart illustration. market volatility chart for stock trading, cryptocurrency background.
-
 Stock market crypto Candlestick pattern in forex or stock market in green and red colors. Vector illustration
-
 Financial trade concept. Stock market and exchange. Candle stick graph chart.
-
 Stock market and forex candlestick chart graph. Digital trading, global economy, business finance, financial investment concept. Vector illustration
-
 Stock market or forex trading platform with dashboard interface
-
 Business candlestick stock chart on dark background. stock investment trading. up trend concept.
-
 Stock market investment trading graph in graphic concept suitable for financial investment or Economic trends business idea. Vector design.
-
 Business candle stick graph chart of stock market investment trading on blue background. Bullish point, up trend of graph. Economy vector design.
-
 Stock market crash caused by, economic graph with diagrams, business and financial concepts and reports, abstract blue technology communication concept vector background
-
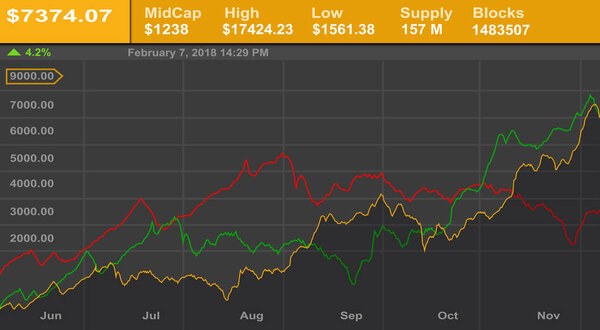 Business graph and stock diagram
-
 Business candle stick graph chart of stock market investment trading, Bullish point, Bearish point. trend of graph vector design.
-
 Candlestick stock exchange background
-
 Abstract infographic visualization. Financial chart with uptrend line graphs and candlesticks. Futuristic network or business analytics. Graphic concept for your design.
-
 Abstract financial chart with uptrend line graph and candlestick on black and white color background. Vector
-
 Stock Market Listing
-
 Business candle stick graph chart of stock market investment trading on blue background. Bullish point, Trend of graph. Eps10 Vector illustration.
-
 Stock and Graph design background. Business graph banner design eps10 vector. Illustration.
-
 World business graph or stock market chart or forex trading graph in graphic concept. Financial investment or business economic trend candlestick graph. Business idea and technology innovation design.
Each vector opens in a new tab with its details. Premium files are sold by Depositphotos; we may earn a commission if you buy. How this works.

