Index chart graph vectors
100 index chart graph vector illustrations picked from 6.8M royalty-free files, with no more than 3 per artist so you see real variety. Every file is a scalable EPS that opens in Illustrator, CorelDRAW, Affinity Designer and Inkscape, and exports to SVG or PNG at any size.
-
 Stock exchange board, market index graphs and charts, vector background. Stock exchange board display with prices and currency financial data of electronic trade rates
-
 Abstract background of relative strength index (RSI) stock market chart graph on white background
-
 Stock exchange board background, market index graphs and charts, vector ticker display. Stock exchange screen with financial trade index rates, finance fund stocks price increase and decrease charts
-
 Stock exchange board with market index, graphs and charts. Vector background with trade tickers, currency rate growth and drop on black display. Trading data with bonds prices, financial investment
-
 Stock market trading technical analysis bar chart fall. Business exchange candlestick graph downtrend. Crisis economy and investment loss graph. Trader financial index crash banner. Black background
-
 World stock market index graph. Candlestick chart, line graph and bar chart. Stock market growth illustration. Financial market background. Blue color. Vector illustration
-
 World stock market index graph. Candlestick chart, line graph and bar chart. Glow light. Stock market growth illustration. Financial market background. Dark Blue color. Vector illustration
-
 Stock market trading technical analysis bar growing candlestick chart. Business exchange bullish trend graph. Trader financial investment growth moving up index eps banner. Savings and income concept
-
 World stock market index graph. Candlestick chart, line graph and bar chart. Stock market growth illustration. Financial market background. Dark Blue color. Vector illustration
-
 Stock market investment trading technical analysis bar candlestick chart. Business exchange growing trend graph. Trader financial investment growth moving up index banner concept. Eps
-
 Financial stock market graph on stock market investment trading, Bullish point, Bearish point. trend of graph for business idea and all art work design. vector illustration.
-
 Business graph for infographics
-
 Financial Graph Chart
-
 Body mass index chart, man and woman silhouette, vector BMI scale of health, obesity and overweight. Body mass index infographic on female and male fat obese weight and underweight BMI scale
-
 3d Business graph
-
 3d graph for infographics
-
 Bar chart graph background, concept of stock exchange vector illustration
-
 Stock Market Graph
-
 Business process chart infographics with 5 step options. Workflow graphic elements. Can be used for info graphics, flow charts, presentations, web sites, banners, printed materials.Vector illustration
-
 Demand Supply chart
-
 Abstract background with stock graph. Eps10 Vector illustration.
-
 Line Graph Data Presentation Vector Illustration
-
 Bar financial data graph. Forex stock crypto currency trading pattern.
-
 Economic graph with diagrams on the stock market, for business and financial concepts and reports. Abstract white vector background.
-
 Technical analyze graphic with candlestick chart illustration. market volatility chart for stock trading, cryptocurrency background.
-
 Stock market investment trading graph concept background. Economic trends, forex and crypto graphic. Vector illustration. EPS 10.
-
 Stock market graph or forex trading chart for business and financial concepts. Stock market data. Bullish point, Trend of graph. Vector illustration
-
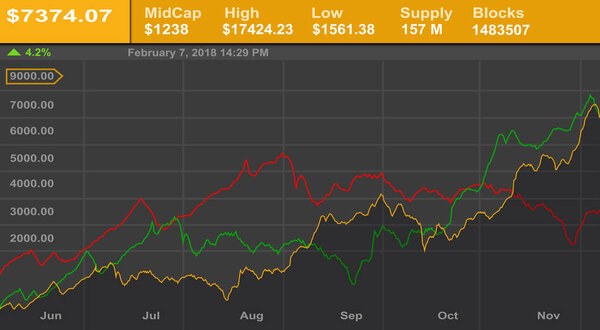 Business graph and stock diagram
-
 Stock market or forex trading graph. Chart in financial market vector illustration Abstract finance background
-
 Illustration of financial chart of growing and falling market. Blue display of trend index on white background - vector
-
 Candlestick chart of trading on the stock exchange. Trading cryptocurrency, stocks and bonds. Candlestick patterns in cryptocurrency trading. Design for banners and posters. Vector illustration
-
 Candlestick chart. stock and line charts. colored financial graph
-
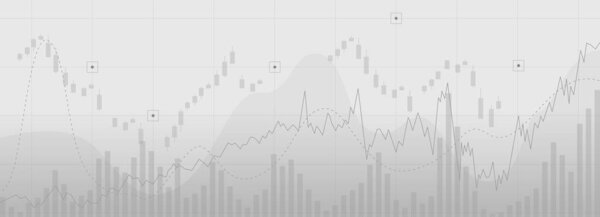 Trend line graph on gradient background, line chart diagram financial chart with sideways line graph and candlestick.
-
 Abstract financial chart with uptrend line graph on blue background.
-
 Forex chart backdrop with candlestick and index grid.
-
 Financial data graph chart on grey background. Business background with candlesticks chart for reports and investment. Financial market trade concept.
-
 Business candle stick graph chart of stock market investment trading with world map. Stock market and exchange. Stock market data. Trend of graph. Vector illustration for your design
-
 Stock market investment trading graph in graphic concept suitable for financial investment or Economic trends business idea. Vector design.
-
 Stock market investment trading graph or forex graph global network line wire frame data business concept for financial investment economic trends vector illustration
-
 Abstract financial chart with uptrend line graph and candlestick on black and white color background. Vector
-
 Business candle stick graph chart of stock market investment trading, Bullish point, Bearish point. trend of graph vector design.
-
 Candlestick trading graph, investing stocks market,buy and sell sign candlestick, vector illustration
-
 Stock market or forex trading graph chart suitable for financial investment concept. Economy trends background for business idea. Abstract finance background. Vector illustration.
-
 Abstract financial graph with uptrend line,widescreen abstract chart and candlestick on gradeint color background
-
 Abstract background of blue volume analysis or volume at price with market graph candlestick green red
-
 Stock market and forex candlestick chart graph. Digital trading, global economy, business finance, financial investment concept. Vector illustration
-
 Paris, France - october 28, 2019: stock market index and real rates with a green shade
-
 Business candlestick stock chart on dark background. stock investment trading. up trend concept.
-
 Stock market, economic graph with diagrams, business and financial concepts and reports, abstract technology communication concept vector background
-
 Crypto market candlestick chart on dark background. red-green candlesticks with upside arrow indicate. analysis, investment, trading, cryptocurrency, business finance
-
 Stock market investment trading illustration concept. Financial bar chart, yield curves, bond data, and upward-sloping graph on a white background. Business candlestick trend graph
-
 Stock exchange vector background. Stock market candlestick chart. Buy and sell indicators for trade on the chart. Financial diagram with assets values moving up and down. Vector illustration.
-
 Financial trade concept. Stock market and exchange. Candle stick graph chart.
-
 Blue stock market or financial candlestick chart with rising and increase trend and text - vector
-
 Business candle stick graph chart of stock market investment trading on blue background. Bullish point, up trend of graph. Economy vector design.
-
 Stock market crash caused by, economic graph with diagrams, business and financial concepts and reports, abstract blue technology communication concept vector background
-
 Financial graph or stock chart. Vector i
-
 Abstract infographic visualization. Financial chart with uptrend line graphs and candlesticks. Futuristic network or business analytics. Graphic concept for your design.
-
 Chart and graph chalk icons set. Radial diagram with increasing
-
 Abstract financial ascending linear graph with numbers
-
 Stock market or forex trading graph in futuristic concept for financial investment or economic trends business idea. Financial trade concept. Stock market and exchange Candle stick graph chart vector.
-
 Bar graph and stock charts of investment trading in stock market. Statistics and report concept. Vector illustration in cartoon style.
-
 Illustration of orange business chart of growth and fall in stock, money or commodity prices with lines and background change - vector
-
 Business candle stick graph chart of stock market investment trading on blue background. Bullish point, Trend of graph. Eps10 Vector illustration.
-
 Stock market candlestick chart vector illustration. Buy and sell indicators for trade on the chart. Financial diagram with assets values moving up and down.
-
 Stock and Graph design background. Business graph banner design eps10 vector. Illustration.
-
 World business graph or stock market chart or forex trading graph in graphic concept. Financial investment or business economic trend candlestick graph. Business idea and technology innovation design.
-
 Stock market background or forex trading business graph chart for financial investment concept of Uzbekistan map. business idea and technology innovation design.
-
 Stock chart green and red candles
-
 Financial chart with uptrend line graphs and candlesticks. Abstract infographics visualization. Graphic concept for your design
-
 Stock market chart on white laptop screen. Growing financial index. Low poly, wireframe 3d vector illustration. Abstract, polygonal image on blue neon background
-
 Stock market or forex trading graph and candlestick chart suitable for financial investment concept. Economy trends background for business idea and abstract finance background. Vector illustration.
-
 Stock trading japanese candlesticks trading chart vector illustration isolated on white background
-
 Business financial stock trading chart with ascending graph and growth lines on white background.
-
 Business Ratings and Charts Collection. Infographic Elements
-
 Red arrow pointing downwards showing crisis. Graph chart down icon. Realistic 3d vector illustration isolated on white background
-
 Business financial blue abstract background with uptrend candle stick pattern of stock market, investment growth success finance business chart
-
 Stock market bar graph, candlestick chart, finance trade data.
-
 Financial graph 2
-
 Vector Business graph with arrow showing profits and gains Abstract of financial stock data Stock
-
 Stock market investment trading graph on blue background. Vector illustration design.
-
 Stock market crypto candlestick chart and indicators on dark background. red-green candlesticks with digital technology concept, business growth, financial, investment
-
 Infographic elements data visualization vector design template. Can be used for steps, options, bar and line charts, percents, pie charts, diagram, flowchart, timeline, marketing icons, info graphics.
-
 Economy business crisis and graph investment down on red background. arrow trading chart candlestick fall. vector illustration fantastic technology.
-
 A luxury, gold graph for Stock market charts and forex trading graph in up trend concept for financial investment or Economic trends business idea, For down trend grapghs
-
 Financial Graph
-
 Laptop trading chart on screen in 3D cartoon realistic style. Candle stick diagram cryptocurrency market analysis. Financial management and investment concept. Vector illustration
-
 Business data analytics. Financial graph chart. Graph chart of stock market investment trading. Abstract analisys and statistic diagram. vector illustration
-
 World Map with Financial Data Graph Chart on Blue Background.
-
 Line graph of the financial market with a sharp drop. Crisis movement in the financial market. Vector business graphics.
-
 Stock market growth in futuristic technology style. Successful financial graphic on blue background. Business growth illustration with the bar chart static and up arrow.
-
 Set of infographic templates
-
 Stock price increases. traders watch stock price movements. a businessman or analyst analyzes data. observe market data patterns and stock transaction volume. illustration concept design
-
 Stagflation as finance crisis and economy recession tiny person concept
-
 Business project, presentation, analysis concept
-
 Presentation of business project concept
-
 Stock exchange rates on monitors
-
 Modern number list infographic banner
-
 Infographs - tag labels - memo post it notes
-
 Candlestick stock exchange background
Each vector opens in a new tab with its details. Premium files are sold by Depositphotos; we may earn a commission if you buy. How this works.