Graph information report vectors
100 graph information report vector illustrations picked from 6.7M royalty-free files, with no more than 3 per artist so you see real variety. Every file is a scalable EPS that opens in Illustrator, CorelDRAW, Affinity Designer and Inkscape, and exports to SVG or PNG at any size.
-
 Color Graph Chart Icons Set. Vector
-
 Graph up
-
 Chart, column graph, infographic element. Finance and economy with yellow vector.
-
 Bar Graph
-
 Mobile charts UI. Phone screen with dashboard analytics, diagrams and bars with stock statistics and forecasts. Financial statement schemas for presentation, vector report templates
-
 Pictograph of graph icon
-
 Simple color financial management reports icon
-
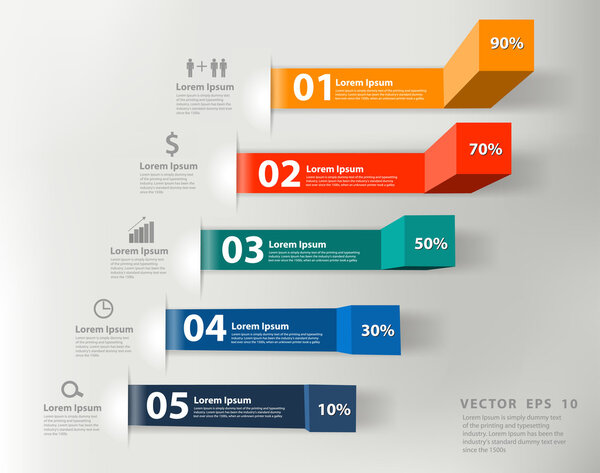 Modern business steps to success charts and graphs options banner
-
 Finance trader graph information, buy and sale broker.
-
 Question mark, Diagram and Diagram chart line icons set. Exhibitors sign. Ask support, Growth graph, Presentation graph. Information desk. Education set. Line question mark outline icon. Vector
-
 Financial Graph Chart
-
 Vector line graph element. Modern simple chart background.
-
 Business report icon
-
 Tablet with 3d graph
-
 Business report, office folded paper document. Isolated icon with long shadow. Charts graphs on a paper. Accounting, analysis, research, planning, audit, report, management. Vector
-
 Business report, paper document with magnifying glass. Isolated icon with long shadow. Charts graphs on a paper. Accounting, analysis, research, planning, audit, report, management. Vector
-
 Financial report icon
-
 Paper folder and pen. Folder with the report documents. Vector illustration of a flat design. Management and planning concept.
-
 Rising graph simple web icon
-
 Charts, graphs, arrows, monochrome hand drawn infographic elements, business economic and financial templates vector Illustration
-
 Pictograph of graph with arrow
-
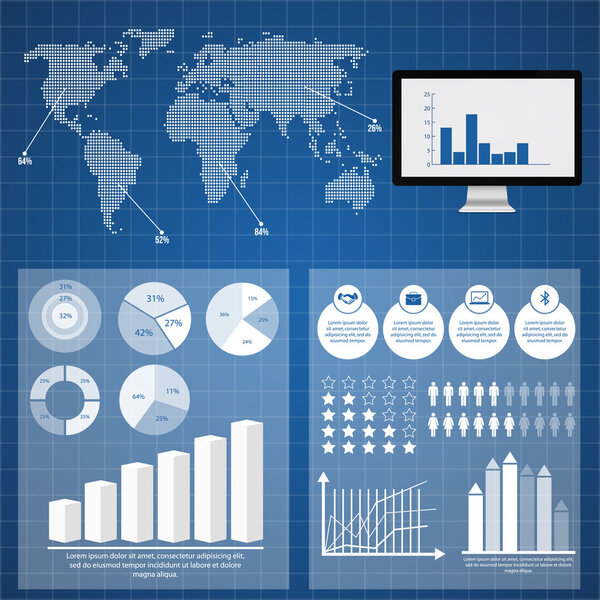 Retro infographics set. World Map and Information Graphics
-
 Information chart line icon
-
 Pictograph of graph in hand
-
 Bar Chart Graph Diagram Financial Analytic Statistical Business Infographic Illustration
-
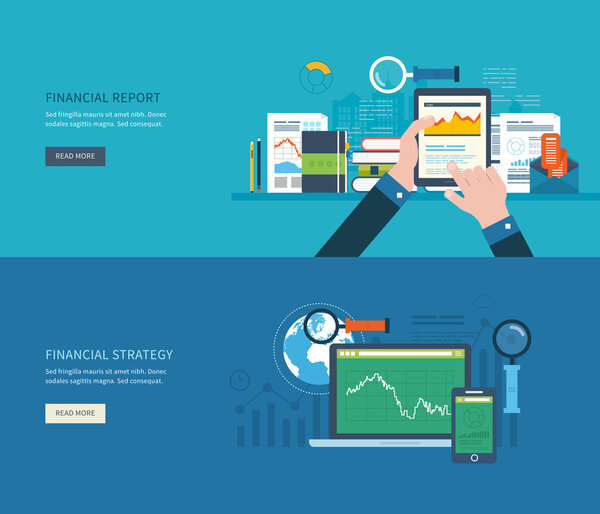 Analyzing project, financial report
-
 Infographic timeline report template
-
 Report
-
 Financial Report Doodle Concept
-
 Set line Clean paper, Report file document, Heart with shield and Document with graph chart. Blue square button. Vector
-
 Set of colored business graphs
-
 Charts and Pie Diagrams with Numbers Information
-
 Line Graph Data Presentation Vector Illustration
-
 Set analysis bar graph
-
 Business chart, financial analysis, marketing report vector concept
-
 Business analysis, financial report
-
 Business analytic graph in tablet device concept .hand hold paper graph.
-
 Vector growing graph chart background.
-
 Part of the report with set logos and icons
-
 Business graphs diagrams icons set. vector illustration.
-
 Infographic dashboard template with flat design graphs and charts. Processing and analysis of data
-
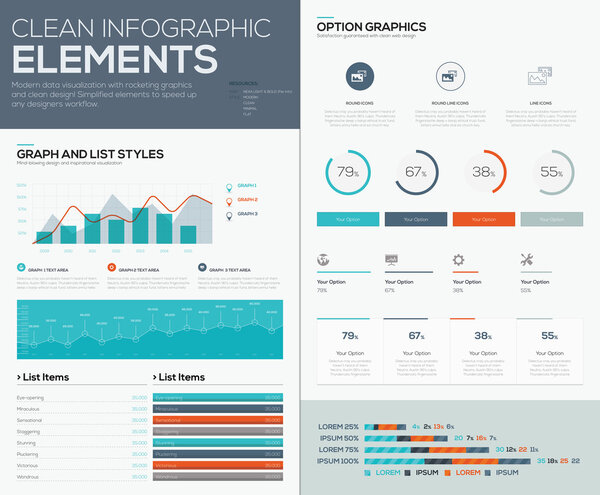 Graphs and pie charts for infographic vector data visualization
-
 World Map and Information Graphics. Vector
-
 Infographics set. World Map and Information Graphics. Vector
-
 INFOGRAPHIC graph ELEMENT
-
 Data analytics representation. Vector laptop with charts and graphs, dashboards and numerical indicators. Dataset flow, processing algorithms and metrics. Financial analysis and AI driven decision
-
 Dashboard info data charts, graphs and diagrams for infographics presentation, vector statistics bars. Finance report, business graphic charts and marketing diagrams with percent pies and flowchart
-
 Flat vector illustration of web analytics information and development website statistic
-
 Big Data Statistics Background
-
 Charts vector set.
-
 Concepts for business analysis
-
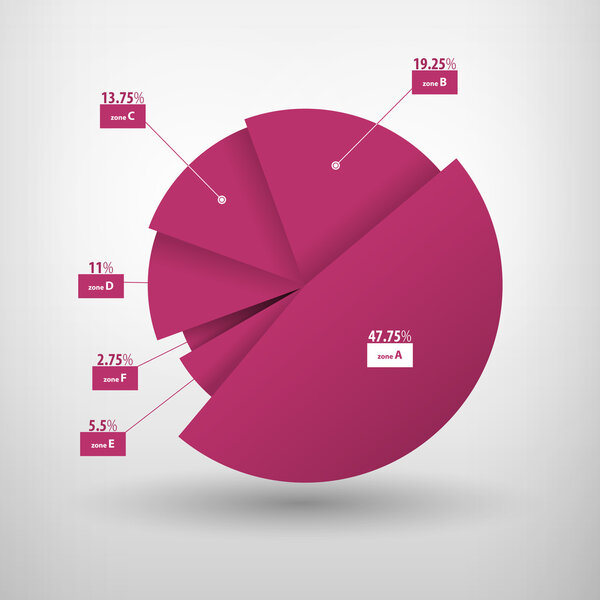 Vector illustration of business diagram.
-
 Detail infographic vector illustration
-
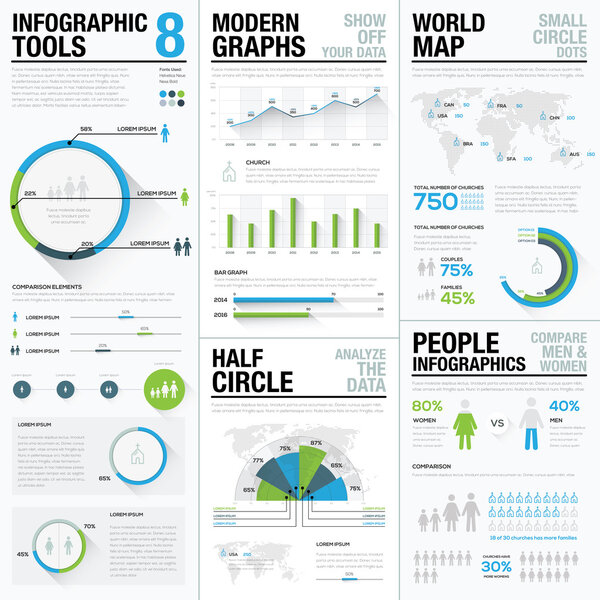 World map infographics & business visualization vector elements
-
 Premium infographics master collection
-
 Business and human vector infographic element big set collection
-
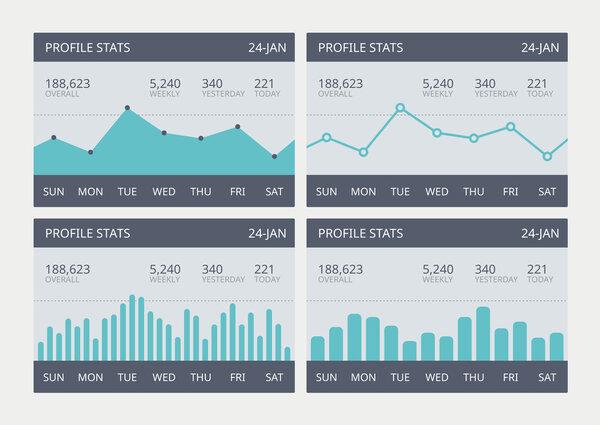 Vector business statistic charts set
-
 Diagram line icons, signs, vector set, outline illustration concept
-
 Isometric Analysis data and Investment. Stack of documents with an official stamp and pencils in a glass. A method for working in the office. Bureaucracy concept
-
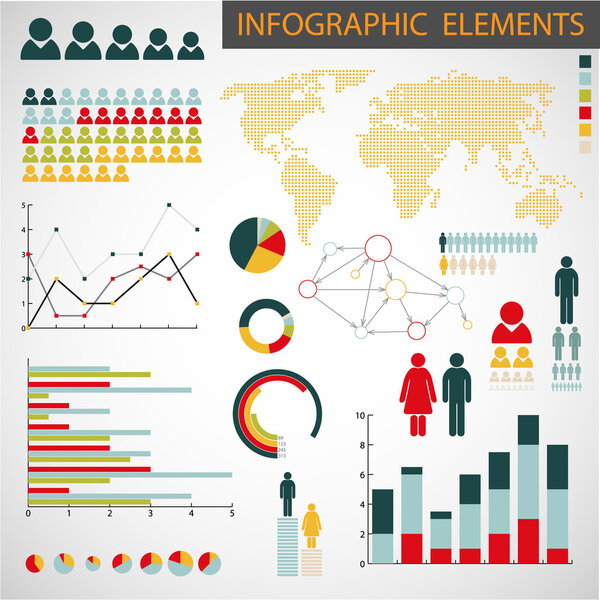 Vector set of Infographic elements
-
 Business charts
-
 Financial Infographic set with charts
-
 Fictitious Website Analytics Data
-
 Credit score, gauge.
-
 Home insurance signs.
-
 Repair, construction icons.
-
 Simple infographic dashboard template
-
 Infographic number options vector design template. Can be used for workflow layout, data visualization, business concept with 6 options, parts, steps or processes, banner, diagram, chart, web design.
-
 Growth Vector Line Icon isolated on white background.
-
 Infographics vector design template. Paper Ribbons.
-
 Landing page concept flat isometric illustration. data analysis monitoring team
-
 Business infographics
-
 Set of diverse office employees work with charts and diagrams explore financial statistics. Collection of businesspeople brainstorm develop finance startup. Banking concept. Vector illustration.
-
 Pie diagram sign vector line icon, sign, illustration on background, editable strokes
-
 Stock price increases. traders watch stock price movements. a businessman or analyst analyzes data. observe market data patterns and stock transaction volume. illustration concept design
-
 Vector businessman on line communication connection business
-
 Forex stock market investment trading concept, Candlestick pattern with bullish and bearish is a style of financial chart.
-
 Business Infographic icons. Vector illustration. can be used for workflow layout, banner, diagram, number options, web design, timeline template.
-
 Business analysis technology isometric vector illustration.
-
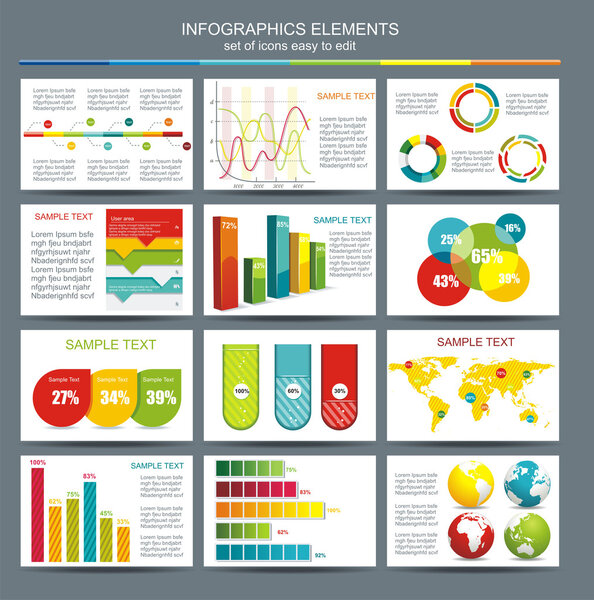 Detail infographic vector illustration. World Map and Informatio
-
 Finance And Chart sign. Green scribble Icon with solid contour on white background.
-
 Growth vector illustration. Flat tiny
-
 Infographic circular with six steps, parts, icons. Flat vector template. Can be used for diagram, business, web, banner, workflow layout, presentations, flow chart, timeline, content, levels.
-
 Vector infographics and design elements with icon set for brochures, flyers and websites
-
 Charts Collection on Laptop Vector Illustration
-
 Financial administration, examiner, audit isometric concept with characters. Company tax and account.
-
 Iinfographics Elements Design
-
 Timeline Infographics Template
-
 Business presentation concept with 5 options
-
 Marketing Analytics Concept
-
 Infographic elements - set of paper tags
-
 Web Template of infochart
-
 Hand draw doodle business finanse elements pattern
-
 Flat background with papers.Temwork concept. Global communication and working expierence. Business, briefing organization. Money making and analyzing.
-
 Hand draw doodle web charts business finanse elements
-
 Timeline template with icons
-
 Hand fills contract, business concept on blue background in a fl
-
 Set of vector business charts, statistic, diagrams
-
 Landing page concept flat isometric illustration. digital transformation analyst data monitoring
-
 Simple business timeline infographic with 6 step business process in blue color
Each vector opens in a new tab with its details. Premium files are sold by Depositphotos; we may earn a commission if you buy. How this works.