Graph chart report vectors
100 graph chart report vector illustrations picked from 6.1M royalty-free files, with no more than 3 per artist so you see real variety. Every file is a scalable EPS that opens in Illustrator, CorelDRAW, Affinity Designer and Inkscape, and exports to SVG or PNG at any size.
-
 Graph line icons. Set of Chart presentation, Report, Increase growth graph icons. Analytics testing, Falling demand, Pie chart report. Calendar statistics, Stats. Ab testing, Increase sales. Vector
-
 Charts and Diagrams line icons. Report, 3D Chart, Block diagram and Dot Plot graph linear icons.
-
 Charts and Diagrams line icons. Report, Block diagram, 3D Chart and Dot Plot graph linear icons. Trend, Pyramid and Pie chart report symbols. Presentation infochart, process flow diagram. Vector
-
 Financial data graph chart on grey background. Business background with candlesticks chart for reports and investment. Financial market trade concept.
-
 Info graphic Vector template with 4 options. Can be used for web, diagram, graph, presentation, chart, report, step by step infographics. Abstract background
-
 Arrow infographic concept. Vector template with 4 options, parts, stages, buttons. Can be used for web, diagram, graph, presentation, chart, report, step by step infographics. Abstract background.
-
 Business Chart Icons Set Flat
-
 Color Graph Chart Icons Set. Vector
-
 Financial Infographic set with charts
-
 Set of business flat, 3D design graph. Infographics charts.
-
 Bar Graph
-
 3d business growth bar graph
-
 Financial Graph Chart
-
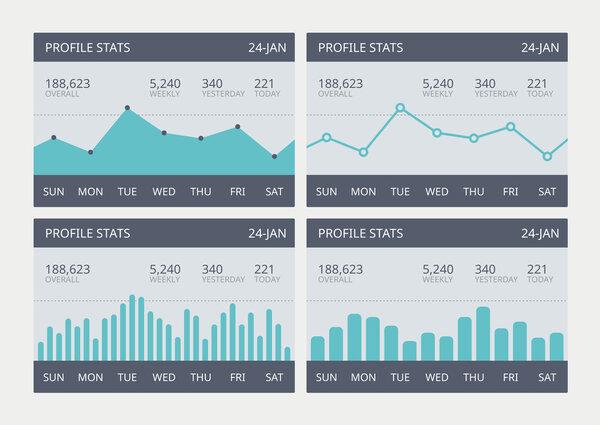 Vector business statistic charts set
-
 Vector colored numbered charts
-
 Rising graph simple web icon
-
 Business data market charts diagrams and graphs
-
 Modern vector infographic flat line template circles for six label, diagram, graph, presentation. Business concept with 6 options and arrows. For content, flowchart, timeline, workflow, marketing
-
 Digital market, finance bank, business rating vector infographics. Graphic design elements set. Histogram and diagram, radial bar, dot matrix, area, pie charts, line graph, choropleth dot world map.
-
 Charts vector set.
-
 Graph up
-
 Chart, column graph, infographic element. Finance and economy with yellow vector.
-
 Company Year Report
-
 Pictograph of graph with arrow
-
 Graph and diagram icon set.
-
 Vector Background with Graphs
-
 Isometric graph chart vector illustration set, 3d infographic element, diagram bar with stats percent or graphic pie chart isolated on white
-
 Bar chart, infographic template for presentation vector illustration
-
 Infographic design elements with map, graph, chart
-
 Business candle stick graph chart of stock market investment trading on blue background. Bullish point, up trend of graph. Economy vector design.
-
 Vector graph bar chart. infographics. vector flat illustration
-
 Businessman climbing up on a ladder to adjust an uptrend graph chart on a wall.
-
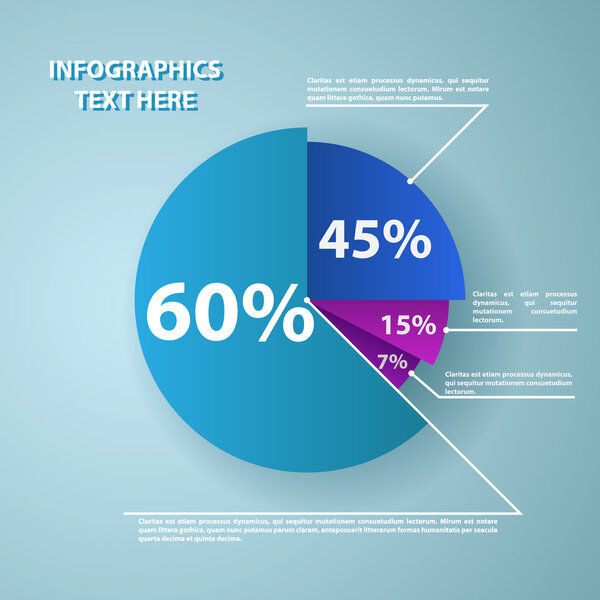 Business pie chart for documents and reports
-
 Chart vector illustration on a transparent background.Premium quality symbols.vector line flat icon for concept and graphic design.
-
 Set of blue-themed financial graphs depicting data trends, including line and area charts. Illustrating business growth and analytics. Concept of economics, financial analytics and growth
-
 Tablet screen with graph and a hand
-
 Vector growing graph icon
-
 Graph vector glyph flat icon
-
 Pictograph of graph icon
-
 Simple color financial management reports icon
-
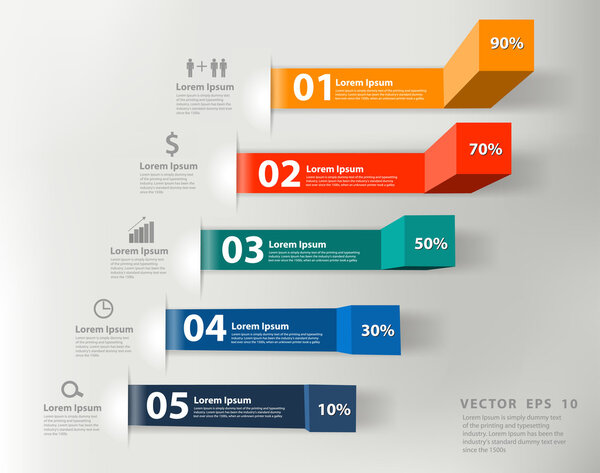 Modern business steps to success charts and graphs options banner
-
 Mobile charts UI. Phone screen with dashboard analytics, diagrams and bars with stock statistics and forecasts. Financial statement schemas for presentation, vector report templates
-
 Creative office infographic and pie chart design collection with work process steps. Modern business presentation elements and diagram vector bundle. Abstract data visualization infographic set vector
-
 Graph chart decline
-
 Graph chart in hand icon
-
 Financial graph chart. Business data analytics. Diagram growth and success in business. vector
-
 Growth graph chart icon
-
 Business chart report
-
 Business diagram graph chart.
-
 Circle graph chart
-
 Business Financial Graph Chart Diagram
-
 Business candle stick graph chart of stock market investment trading, Bullish point, Bearish point. trend of graph vector design.
-
 Graph Chart Line Icons
-
 Candle stick graph chart of stock market investment trading, Bullish point, Bearish point. trend of graph vector design.
-
 Graph, chart, 3D. Infographics.
-
 Bar chart and pie chart illustration, researching data, analysis, monitoring, financial statistic
-
 Icon Colorful bar graph chart. Business illustration isolated si
-
 Candle stick graph chart of stock market investment trading bitcoin
-
 Business abstract logo symbol. Growth creative symbol concept. Increase, bank profit, grow up arrow abstract business logo. Stock finance market, progress line, graph chart icon.
-
 Bar Graph Chart Data Information Infographic
-
 Business strategy and workflow information diagram vector for office presentations. Abstract data and info graph chart vector with colorful segments. Business and work step presentation infographic.
-
 Total liquidation concept illustration with business man working on a paper work document and signing graph chart
-
 Business people working together with graph chart and statistics. vector illustration
-
 Round infographic 8 steps net flow chart. Diagram, graph, chart, flowchart, banner template. Vector.
-
 Vector phone with graph, chart, raiting elements
-
 Web traffic analysis chart, report summary vector illustration
-
 Infographics vector design template. Creative diagram.
-
 Modern minimal colorful arrow infographics elements
-
 Premium infographics master collection
-
 Flat web design & website infographics business vector elements
-
 Vector infographic elements
-
 Business Infographic icons. Vector illustration. can be used for workflow layout, banner, diagram, number options, web design, timeline template.
-
 Big Data Statistics Background
-
 Business infographics template. Timeline with 5 circle arrow steps, five number options. World Map in background. Vector element.
-
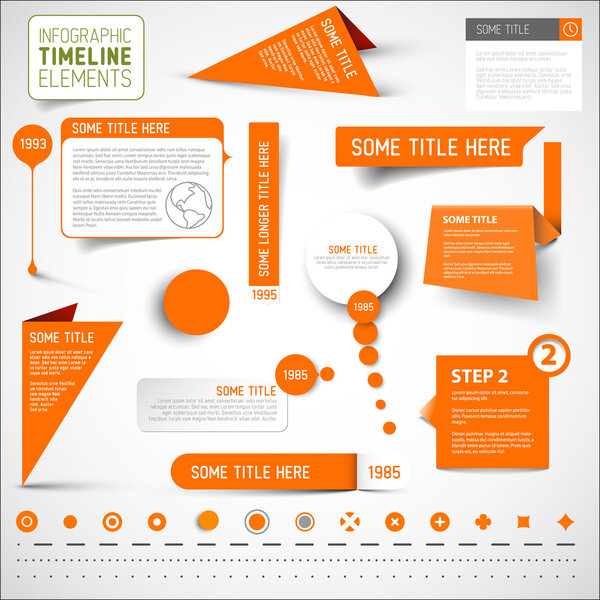 Orange infographic timeline elements
-
 Infographics for medicine. For advertising, presentations or an information banner
-
 Business presentation templates
-
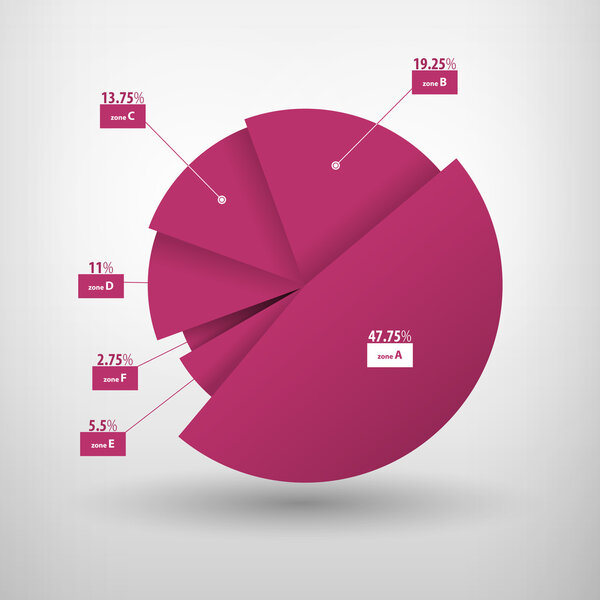 Vector illustration of business diagram.
-
 Arrow growth graphic icon
-
 Business and human vector infographic element big set collection
-
 Detail infographic vector illustration. World Map and Informatio
-
 Detail infographic vector illustration
-
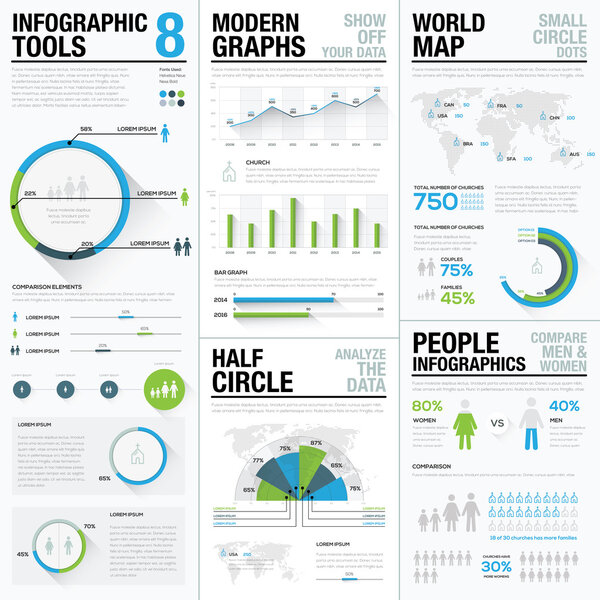 World map infographics & business visualization vector elements
-
 Business Infographic Template. Data Visualization. vector illust
-
 Data analysis flat line illustration
-
 Business background
-
 Data Analytics icons graphic design tools ui icon collection
-
 Data analysis icon concept
-
 Finance background
-
 Diagram line icons, signs, vector set, outline illustration concept
-
 Isometric Analysis data and Investment. Stack of documents with an official stamp and pencils in a glass. A method for working in the office. Bureaucracy concept
-
 4 steps infographics design template. Multicolored circular elements with space for text
-
 Fictitious Website Analytics Data
-
 Timeline infographic template with 6 options on white background, vector illustration
-
 Economy and money related icons image
-
 Man reading a newspaper
-
 Business progress concept. Hand drawn isolated vector.
-
 3D infographic diagram data visualization template with 4 option
-
 Simple infographic dashboard template
-
 Work strategy and process steps data visualization template for office or business presentations. Abstract business infographic timeline layout and flowchart design. Workflow diagram layout vector.
Each vector opens in a new tab with its details. Premium files are sold by Depositphotos; we may earn a commission if you buy. How this works.