Graph chart data vectors
100 graph chart data vector illustrations picked from 5.6M royalty-free files, with no more than 3 per artist so you see real variety. Every file is a scalable EPS that opens in Illustrator, CorelDRAW, Affinity Designer and Inkscape, and exports to SVG or PNG at any size.
-
 Bar Graph Chart Data Information Infographic
-
 Flat 3d Isometric Ai Robot Floating and Analyse Virtual Business Graph Chart. Data Analysis and Artificial Intelligence Concept.
-
 Business data market charts diagrams and graphs
-
 Education icons set. Included icon as Graph chart, Cogwheel, Update data signs. Speech bubble, Feedback, Line graph symbols. Creativity, Report line icons. Growth report, Engineering. Vector
-
 Set of blue-themed financial graphs depicting data trends, including line and area charts. Illustrating business growth and analytics. Concept of economics, financial analytics and growth
-
 Data analytics, graph, chart Web icons set. Vector illustration
-
 Financial graph chart. Business data analytics. Diagram growth and success in business. vector
-
 Stock market and exchange. Candle stick graph chart of stock market investment trading. Stock market data. Bullish point, Trend of graph. Vector illustration
-
 Financial data graph chart on grey background. Business background with candlesticks chart for reports and investment. Financial market trade concept.
-
 Stock market and exchange. Business Candle stick graph chart of stock market investment trading. Stock market data. Bullish point, Trend of graph. Vector illustration.
-
 Business Chart Icons Set Flat
-
 Color Graph Chart Icons Set. Vector
-
 Financial Infographic set with charts
-
 Bar Graph
-
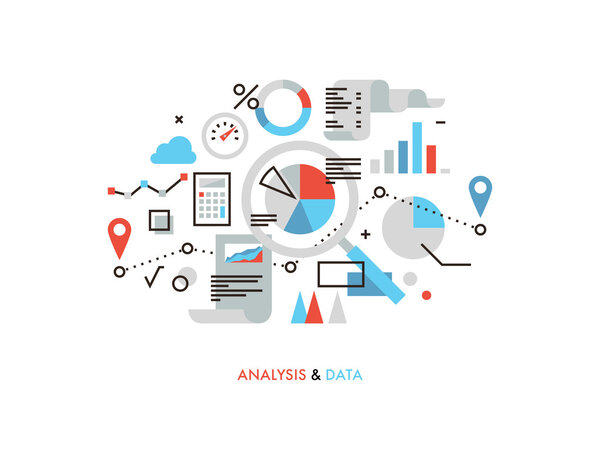 Data analysis flat line illustration
-
 Big infographic vector elements collection to display data
-
 Financial Graph Chart
-
 Business Graphs & Charts Icons - Blue Series
-
 3d business growth bar graph
-
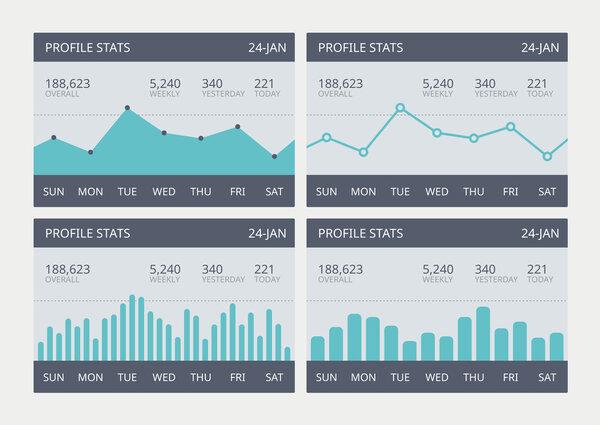 Vector business statistic charts set
-
 Vector colored numbered charts
-
 Vector template circle infographics. Business concept with 5 options, arrows and parts. Five steps for graph, diagrams, slideshow
-
 Big Data Statistics Background
-
 Rising graph simple web icon
-
 Vector infographics set. Collection of templates for cycle diagram, graph, presentation and round chart. Business concept with options, parts, steps or processes.
-
 Vector flat template circle infographics. Business concept with 6 options and arrows. Six steps for content, flowchart, timeline, levels, marketing, presentation, graph, diagrams, slideshow
-
 Vector flat infographic template. Circles with text and icons for five diagrams, graph, flowchart, timeline, marketing, presentation. Business concept with 5 options
-
 Charts vector set.
-
 Data analysis, statistics, analytics - minimal thin line web icon set. Outline icons collection. Simple vector illustration
-
 Financial stock market graph on stock market investment trading, Bullish point, Bearish point. trend of graph for business idea and all art work design. vector illustration.
-
 Diagram graph Pie chart.
-
 Business report paper with graph online on top of notebook vector graphic illustration
-
 Graph up
-
 Small people working around big page with various infographics. Data analysis. Poster, card for presentation, web page, banner, social media. Flat design vector illustration
-
 Chart, column graph, infographic element. Finance and economy with yellow vector.
-
 Data icon set
-
 Business people analytic business graph and SEO on web
-
 Vector Business Graph on Display Icon
-
 Vector circle arrows infographic. Template for cycle diagram, graph, presentation and round chart. Business concept with 3, 4, 5, 6, 7, 8 options, parts, steps or processes. Big bundle includes 24
-
 Pictograph of graph with arrow
-
 Graph and diagram icon set.
-
 Vector Background with Graphs
-
 Data analytic
-
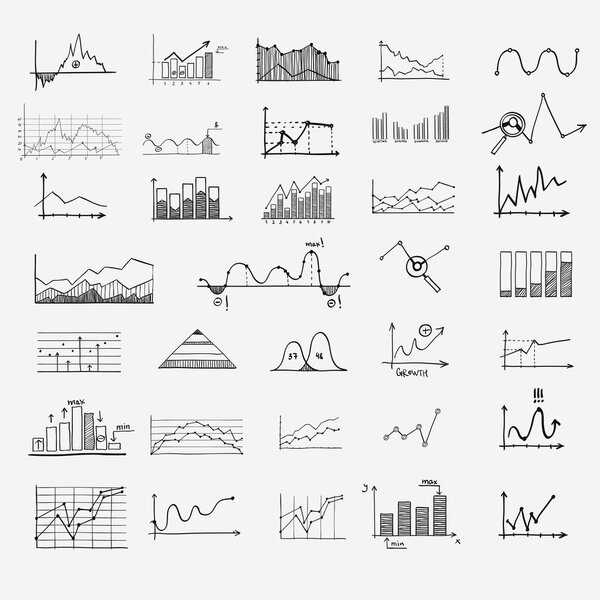 Business finance statistics infographics doodle hand drawn elements. Concept - graph, chart, arrows signs, search earnings money profit
-
 Business Infographic Template. Data Visualization. vector illust
-
 Display with business graph icon with long shadow.
-
 Isometric graph chart vector illustration set, 3d infographic element, diagram bar with stats percent or graphic pie chart isolated on white
-
 Charts and Diagrams line icons. Set of 3D Chart, Block diagram and Dot Plot graph icons. Vector
-
 Infographic design elements with map, graph, chart
-
 Data Analytics icons graphic design tools ui icon collection
-
 Business candle stick graph chart of stock market investment trading on blue background. Bullish point, up trend of graph. Economy vector design.
-
 Business Graph icon set. Thin Line icons
-
 Vector circle star infographic. Template for diagram, graph, presentation and chart. Business concept with 5 options, parts, steps or processes. Abstract background.
-
 Business Graph icon set
-
 Infographic Elements.Big chart set icon.
-
 Global pie chart statistics
-
 Business data analysis
-
 Bar chart, infographic template for presentation vector illustration
-
 Data analysis icon concept
-
 Vector graph bar chart. infographics. vector flat illustration
-
 Profit and lost money or budget. Cash and rising graph arrow up, concept of business success. Capital earnings, benefit. Vector stock illustration
-
 Tablet screen with graph and a hand
-
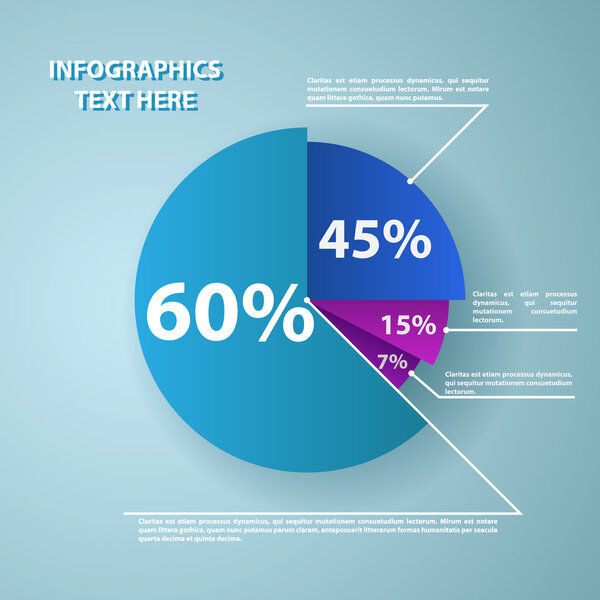 Business pie chart for documents and reports
-
 Vector growing graph icon
-
 Process chart template 2
-
 Chart vector illustration on a transparent background.Premium quality symbols.vector line flat icon for concept and graphic design.
-
 Creative office infographic and pie chart design collection with work process steps. Modern business presentation elements and diagram vector bundle. Abstract data visualization infographic set vector
-
 Flat icon a recession or stock market crash with graph chart isolated on the laptop
-
 Fictitious Website Analytics Data
-
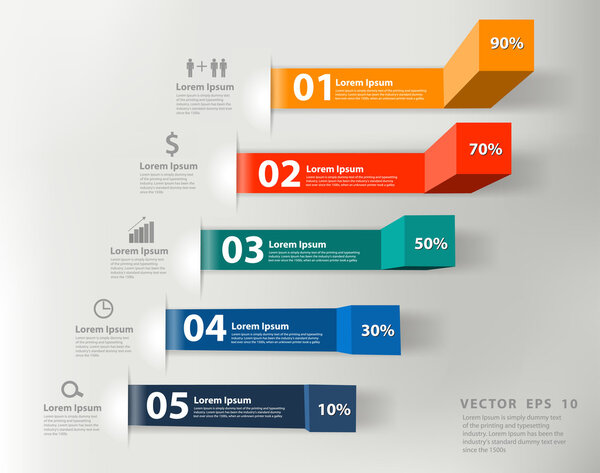 Modern business steps to success charts and graphs options banner
-
 Graph chart decline
-
 Graph chart in hand icon
-
 Pictograph of graph icon
-
 Graph chart stock market. Trend of graph vector illustration.
-
 Growth graph chart icon
-
 Candle stick graph chart of stock market investment trading, Bullish point, Bearish point. trend of graph vector design.
-
 Business diagram graph chart.
-
 Circle graph chart
-
 Business candle stick graph chart of stock market investment trading ackground design. Stock market chart. Bullish point, Trend of graph. Vector illustration.
-
 Financial trade concept. Stock market and exchange. Candle stick graph chart.
-
 Business Financial Graph Chart Diagram
-
 Business candle stick graph chart of stock market investment trading, Bullish point, Bearish point. trend of graph vector design.
-
 Tablet Chart
-
 Graph Chart Line Icons
-
 Stock market background or forex trading business graph chart for financial investment concept of Jamaica map. business idea and technology innovation design.
-
 Blue business graph chart design with high and low point
-
 Infographic flat design column graph
-
 Big set of 3 steps round diagram, graph, chart, flowchart, banner template. Vector.
-
 Modern minimal colorful arrow infographics elements
-
 Premium infographics master collection
-
 Business infographics
-
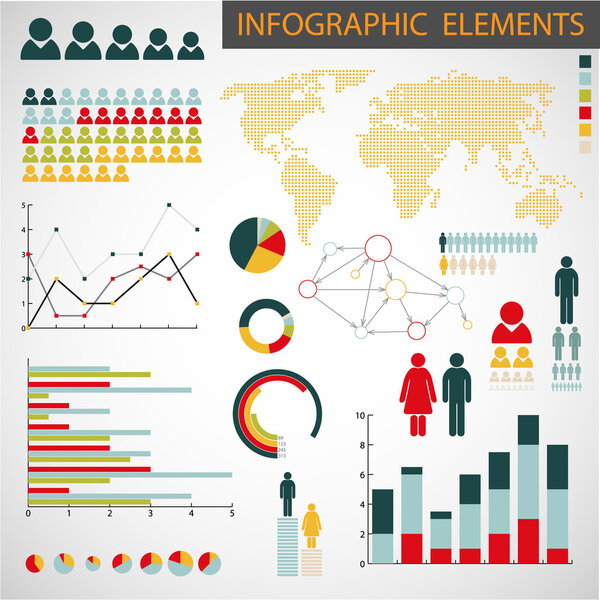 Vector set of Infographic elements
-
 Flat web design & website infographics business vector elements
-
 Business Infographic icons. Vector illustration. can be used for workflow layout, banner, diagram, number options, web design, timeline template.
-
 Simple color financial management reports icon
-
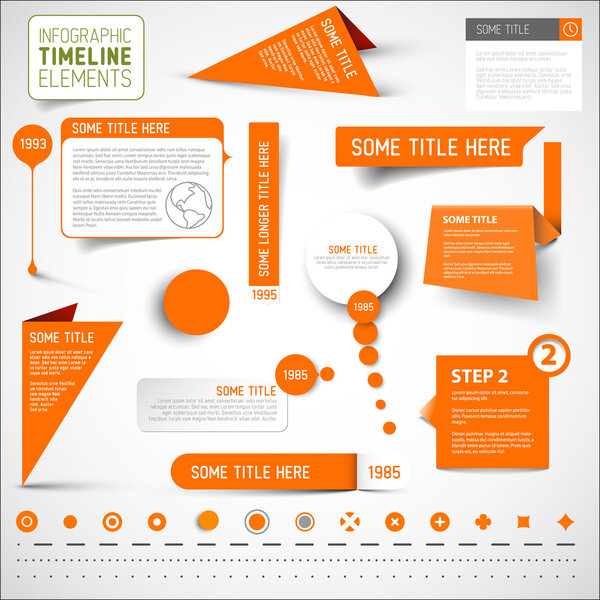 Orange infographic timeline elements
-
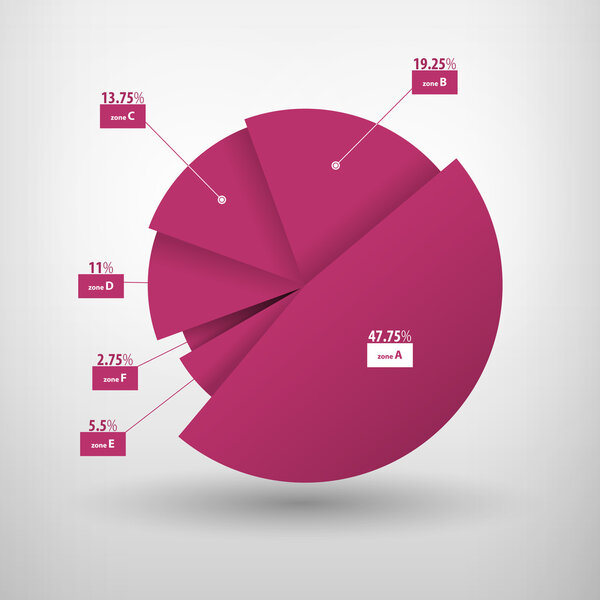 Vector illustration of business diagram.
-
 Arrow growth graphic icon
-
 Business and human vector infographic element big set collection
-
 Detail infographic vector illustration. World Map and Informatio
Each vector opens in a new tab with its details. Premium files are sold by Depositphotos; we may earn a commission if you buy. How this works.
