Axis graph mathematics vectors
100 axis graph mathematics vector illustrations picked from 6.8M royalty-free files, with no more than 3 per artist so you see real variety. Every file is a scalable EPS that opens in Illustrator, CorelDRAW, Affinity Designer and Inkscape, and exports to SVG or PNG at any size.
-
 3d coordinate axis vector
-
 Trigonometrical system of coordinates on graph paper. vector illustration. template for drawing graphs of trigonometric functions.
-
 Blue line XYZ Coordinate system icon isolated on white background. XYZ axis for graph statistics display. Abstract circle random dots. Vector Illustration
-
 Vector illustration of mathematics system of coordinate
-
 Cartesian coordinate system. vector illustration. template for drawing graphs of trigonometric functions
-
 Graphic presentation for two linear functions graphs
-
 Cartesian coordinate system in the plane in two dimensions. X and Y axises with negative and positive numbers on perpendicular lines. Grid paper background. Vector graphic illustration.
-
 Two math axis empty graphic for presentation
-
 Cartesian coordinate system in the plane from 0 to 10 on the graph grid paper. Vector.
-
 Seamless Graph and plotting paper.
-
 Seamless Graph paper.
-
 Cartesian coordinate system in the plane from 0 to 5 on the graph grid paper. Vector.
-
 Graph and plotting paper.
-
 Graphs of the function of inverse proportionality on the numerical axis, blue for a negative coefficient, red for a positive coefficient
-
 Graphic presentation for Constant Identity Absolute value Quadratic Reciprocal and Exponential functions graph
-
 Cosine wave line on bidimensional plane with two perpendicular axes. Trigonometric function graph. Checkered worksheet background. Cartesian coordinate system. Vector graphic illustration
-
 Demand curve example. Graph representing relationship between product price and quantity. Economics model isolated on white background. Vector graphic illustration
-
 Black and white grid, mesh. Seamlessly repeatable plotting, graph paper pattern, texture and background - stock vector illustration, clip-art graphics
-
 Graphic presentation for Constant Linear Absolute value and Quadratic functions graph
-
 Two axis empty graphic for yours drawing
-
 Mathematics Cartesian Coordinate System
-
 The blank system graph in two dimensions. Rectangular orthogonal coordinate plane with axes X and Y on squared grid. Math scale template. Vector illustration isolated on white background.
-
 Quadratic equation algebra formula set roots discriminant factorization vieta function parabola identity polynomial coefficient solution relation condition graph expression
-
 Polar, circular grid, mesh. Pie chart, graph element. Stock vector illustration, clip-art graphics
-
 Hand drawn mathematics formulas on chalkboard for background, banner,book cover and etc. for education industry
-
 Time series analysis with sequence of data points outline hands concept. Scientific statistics and forecasting method for data science vector illustration. Interval of time axis for periodic chart.
-
 Direction of x y and z axis vector
-
 Analyst, Finance the activities of companies and the results of the economic crisis graph indicator on a
-
 Vector illustration of mathematics functions
-
 Seamless background with formulas and charts on the topic of mathematics and education, color sticers on blue background
-
 A wavy graph representing a mathematical function
-
 Seamless background with formulas and charts on the topic of mathematics and education, black marker on white background
-
 Doodle Icons Set Of Mathematics Theme
-
 White graph xy lines, Measuring scale, markup for rulers. Stock Vector illustration isolated
-
 Set of graphs of curves representing mathematical functions
-
 Exponential function graph, math
-
 Teacher explains graph. A woman lecturer leads a distance lesson economic statistics to the student
-
 Simple cosine of x function graph. Wave with one, two and three periods, 3 stroke weight versions.
-
 Teacher explains physics. A woman lecturer leads a distance lesson explains graphs to the student
-
 Logotype XYZ Coordinate system icon isolated on white background. XYZ axis for graph statistics display. Logo design template element. Vector.
-
 Axis blue and red four color minimal icon set
-
 Axis blue gradient vector icon
-
 Axis four color glowing neon vector icon
-
 A blue number four standing between the center of the optical axis and the focal point and its image after reflection by a hollow mirror
-
 Recruitment of exponential growth and logistic growth. Doodle illustration Graph of trend icons for business, profit, presentations and research.
-
 Graphs of trigonometric functions sine, cosine, tangent and cotangent in the interval from zero to two pi
-
 Glowing neon line XYZ Coordinate system on chalkboard icon isolated on brick wall background. XYZ axis for graph statistics display. Vector
-
 Cartesian coordinate system. Blank Cartesian coordinate system in two dimensions with X and Y axes. Black grid with axes for a math graph. Vector
-
 Cube graph. simple orthogonal coordinate plane with axes X and Y. Vector illustration isolated on white background.
-
 Set Chalkboard, Function mathematical symbol, Geometric figure Tetrahedron, Abacus, Cube, Graph, schedule, chart, diagram, Pencil and Computer monitor with graph icon. Vector
-
 Set pop art Graph, schedule, chart, diagram, Pi symbol, XYZ Coordinate system and Geometric figure Cylinder icon. Vector
-
 Set Graph, schedule, chart, diagram, Triangle math, Calculator, Square root, XYZ Coordinate system, Mathematics function cosine, Open book and Human brain icon. Vector
-
 Maths doodle. Hand drawn mathematics formulas on chalkboard for background, banner, book cover and etc. Education industry. Mathematical theory of school education.
-
 Line icon graph with minimum value
-
 Curve formation on graph
-
 A parabola graph representing a mathematical function
-
 Seamless background with formulas and charts on the topic of mathematics and education, colored marker on white background
-
 Graph icon colored symbol. Premium quality isolated line area chart element in trendy style.
-
 Rectangular Coordinate Systems and Graphs. Flat vector illustration.
-
 Mathematical function Vector Style Black thin line
-
 Triaxial system of coordinate on the grid
-
 Cartesian coordinate system on a notebook sheet on a checkered grid. Vector illustration
-
 Blank cartesian coordinate system in two dimensions. Rectangular orthogonal coordinate plane with axes X and Y on squared grid. Math scale template. Vector illustration isolated on white background.
-
 Triaxial system of coordinate
-
 Cartesian Coordinate System In The Plane
-
 Dotted Plot Framed Icon
-
 Cartesian coordinate system in two dimensions with sample points. Rectangular orthogonal coordinate plane with axes X and Y on squared grid. Vector illustration isolated on white background.
-
 Positive And negative Number line. Integers on number line. Whole negative and positive numbers, zero. Math chart for addition and subtraction operations in school isolated on white background. Vector
-
 Sinusoid. A set of sinusoidal waves. Pulse linesisolated on a white background. Vector symbol
-
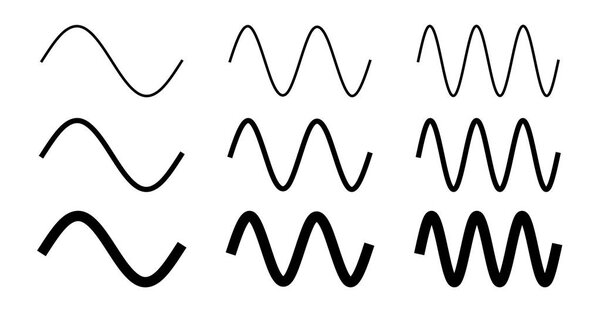 Simple sine wave drawing. One, two and three period with 3 different width.
-
 Graphics on Coordinate System with Grid Collection
-
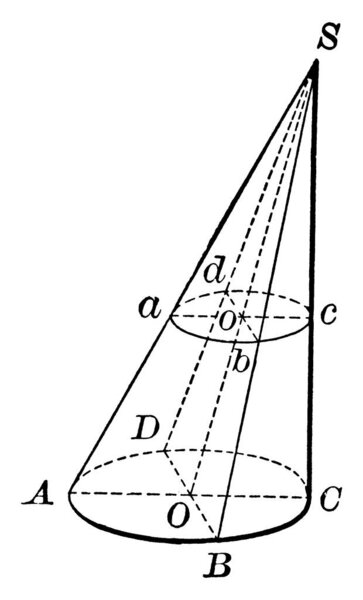 Geometric shape that tapers smoothly from a circular base to a point S called vertex, this shape is also called Cone, vintage line drawing or engraving illustration.
-
 Growth chart
-
 Electromagnetic wave . Electric and magnetic field
-
 The three shapes of conic section are shown the hyperbola, the parabola, and the ellipse, vintage line drawing or engraving illustration.
-
 Abstract stock diagrams - Trader experience
-
 Mathematical scientific vector seamless pattern with geometry plots, tools and formulas. Education elements. Compasses, protractor, pencil, graphics, straight, parabola, formulas, triangle, parallelogram.
-
 Minimalistic White Graphics on Coordinate System
-
 Hand drawn chart
-
 Vector hand drawn business chart
-
 Grahams Law of Diffusion: Grahams law states that the rate of diffusion
-
 Trigonometrical system of coordinate
-
 Business Bar Chart
-
 Functions Plot Flat Icon
-
 Cartesian coordinate system icon. Thin linear cartesian coordinate system outline icon isolated on white background from education collection. Line vector sign, symbol for web and mobile
-
 Vector green radar with sine wave
-
 Dotted Plot Vector Toolbar Icon
-
 Graphic Function
-
 Math
-
 Cosine vector icon editable stroke outline icons for web and mobile
-
 Time series analysis with data points sequence calculation outline diagram. Labeled educational scheme with statistics research method over time vector illustration. Analytic forecasting or analytics
-
 Blank cartesian coordinate system in two dimensions. Rectangular orthogonal coordinate plane with axes X and Y. Math scale system template. Vector illustration isolated on white background.
-
 Vector of parts of a wave crest trough amplitude and wavelength
-
 Mathematical scientific vector seamless pattern with geometry plots, tools and formulas. Education elements. Compasses, protractor, pencil, graphics, straight, parabola, formulas, triangle, parallelogram. Illuminating and Ultimate Gray.
-
 Pointed line chart icon colored symbol. Premium quality isolated increase element in trendy style.
-
 Bar line chart icon colored symbol. Premium quality isolated growth element in trendy style.
-
 Standard deviation as statistics mathematical calculation outline diagram. Labeled educational scheme with sample mean, observed value and formula explanation vector illustration. Math data analysis.
-
 Linear function in the coordinate system
-
 Compressibility Factor (Z) and pressure bar
-
 Line graphic icon, cartoon style
Each vector opens in a new tab with its details. Premium files are sold by Depositphotos; we may earn a commission if you buy. How this works.
