Axis graph chart vectors
100 axis graph chart vector illustrations picked from 7.9M royalty-free files, with no more than 3 per artist so you see real variety. Every file is a scalable EPS that opens in Illustrator, CorelDRAW, Affinity Designer and Inkscape, and exports to SVG or PNG at any size.
-
 Coordinate Axis Gradient Vector Icon
-
 Coordinate Axis Rounded Vector Icon
-
 Trigonometrical system of coordinates on graph paper. vector illustration. template for drawing graphs of trigonometric functions.
-
 Blue line XYZ Coordinate system icon isolated on white background. XYZ axis for graph statistics display. Abstract circle random dots. Vector Illustration
-
 Line Graph Data Presentation Vector Illustration
-
 Graphic presentation for two linear functions graphs
-
 Cartesian coordinate system. vector illustration. template for drawing graphs of trigonometric functions.
-
 X and y axis with numbers vector
-
 Two math axis empty graphic for presentation
-
 Blank x and y axis Cartesian coordinate plane with numbers on white background vector
-
 Blank x and y axis Cartesian coordinate plane with numbers with dotted line on white background vector
-
 Graphs of the function of inverse proportionality on the numerical axis, blue for a negative coefficient, red for a positive coefficient
-
 Growth chart
-
 Vector 3d chart infographics
-
 Demand curve example. Graph representing relationship between product price and quantity. Economics model isolated on white background. Vector graphic illustration
-
 Simple Line Chart Slide Template
-
 Spiral diagram, grid chart with upward trend, data points, and wavy lines. Ideal for analytics, data trends, reports, visualization, information design business insight simple flat metaphor
-
 Doodle drawing growth bar chart
-
 Graphic presentation for Constant Identity Absolute value Quadratic Reciprocal and Exponential functions graph
-
 Graphic presentation for Constant Linear Absolute value and Quadratic functions graph
-
 Positive And negative Number line. Integers on number line. Whole negative and positive numbers, zero. Math chart for addition and subtraction operations in school isolated on white background. Vector
-
 Cortisols diurnal rhythm shows daily hormone fluctuations with a graph, sun, and moon icons. Doodle style diagram
-
 Set of scatter plot diagrams. Scattergrams with different types of variables negative correlation. Data points plotted on a horizontal and a vertical axis on Cartesian plane. Vector flat illustration
-
 Set of scatter plot diagrams. Scattergrams with different types of variables correlation. Data points plotted on a horizontal and a vertical axis on Cartesian plane. Vector flat illustration
-
 Scatter plot color icon. Scattergram. Mathematical diagram. Symbolic representation of information. Chart on coordinate plane. Statistics data visualization. Isolated vector illustration
-
 Line graph infographic template for charts and diagrams
-
 Time series analysis with sequence of data points outline hands concept. Scientific statistics and forecasting method for data science vector illustration. Interval of time axis for periodic chart.
-
 Cartesian map graph
-
 Coordinate grid template chart to analyze the chart
-
 Two axis empty graphic for yours drawing
-
 Vector blue metric graph paper with coordinate axis
-
 Criss-cross, bisect, crosshatch lines grid, mesh. Regular graph-
-
 Line Graph Representing Data Vector Illustration
-
 Set Of Graphs, Diagrams And Statistics Icons. Premium Quality Symbol Collection. Icons Can Be Used For Web, App And UI Design.
-
 Graphics chart in modern flat design.
-
 Cartesian coordinate system in the plane from 0 to 5 on the graph grid paper. Vector.
-
 Bar graph icon colored symbol. Premium quality isolated line chart element in trendy style.
-
 Economic finance graphics chart icon. Market sale diagram graph for presentation. Vector
-
 Analyst, Finance the activities of companies and the results of the economic crisis graph indicator on a
-
 Flat Icon Chart Set Of Infographic, Statistic, Easel And Other Vector Objects. Also Includes Pie, Easel, Diagram Elements.
-
 Grid chart line icon, grid chart line symbol, grid chart line vector, grid chart line eps, grid chart line image, grid chart line logo, grid chart line flat, grid chart line art design
-
 GRAPH
-
 Vector Illustration Of Logical Symbol On Coordinate Axis Icon. Premium Quality Isolated Increasing Element In Trendy Flat Style.
-
 Diagram, the arrow and graph on a white background.
-
 Doodle drawing growth line chart
-
 The blank system graph in two dimensions. Rectangular orthogonal coordinate plane with axes X and Y on squared grid. Math scale template. Vector illustration isolated on white background.
-
 Charts and graphs
-
 Vector hand drawn business chart
-
 Hand drawn chart
-
 Businessman Jumping On Top Of Bar Graphs
-
 Businessman Launching Beyond Bar Graphs By Rocket
-
 Polar, circular grid, mesh. Pie chart, graph element. Stock vector illustration, clip-art graphics
-
 Business Concept As A Businessman Is Running On Growth Line Graph. He Is Enjoying The New Growth Of Opportunity With Full Motivation and Encouragement. Higher Sales Corresponds With Time Passes By
-
 Growth chart black simple line vector icon
-
 A wavy graph representing a mathematical function
-
 Two color spike chart vector icon from business concept. isolate
-
 Dotted Function Graph Rounded Icon
-
 Gauss histogram function graph, parabola line icon.
-
 Repeatable graph, plotting, drafting paper, Grid, mesh, wireframe lattice, grille pattern. Squares, checkered Seamlessly repeatable simple geometric pattern, background
-
 Business Bar Chart
-
 Stress curve educational diagram with performance level graph outline concept
-
 Cartesian coordinate system plane chart axis diagram white.
-
 Seamless background with formulas and charts on the topic of mathematics and education, black marker on white background
-
 Raphic chart with heart icon
-
 Set of graphs of curves representing mathematical functions
-
 Simple cosine of x function graph. Wave with one, two and three periods, 3 stroke weight versions.
-
 Radar chart with pentagon icon in filled, thin line, outline and stroke style. Vector illustration of two colored and black radar chart with pentagon vector icons designs can be used for mobile, ui, web
-
 Vector illustration of mathematics system of coordinate
-
 Mathematical function Vector Style Black thin line
-
 Cartesian coordinate system template
-
 Triaxial system of coordinate on the grid
-
 Cartesian coordinate system on a notebook sheet on a checkered grid. Vector illustration
-
 Blank cartesian coordinate system in two dimensions. Rectangular orthogonal coordinate plane with axes X and Y on squared grid. Math scale template. Vector illustration isolated on white background.
-
 Triaxial system of coordinate
-
 ���������������������������
-
 ���������������������������
-
 Timeline with rainbow milestones and event icons
-
 ���������������������������
-
 Cartesian plane statistics
-
 Timeline with rainbow milestones and icons on dark background
-
 Cartesian coordinate system in two dimensions with sample points. Rectangular orthogonal coordinate plane with axes X and Y on squared grid. Vector illustration isolated on white background.
-
 Abstract stock diagrams - Trader experience
-
 Cartesian Coordinate System In The Plane
-
 3D Isometric Flat Vector Conceptual Illustration of Dunning-Kruger Effect, Comparing self-assessment with objective performance
-
 Mathematics Cartesian Coordinate System
-
 Coordinate axes. Geometric green cartesian scale with blue analytical system in xyz.
-
 Infographic horizontal dark timeline report template
-
 Diagram of a wind turbine farm with abstract business diagram
-
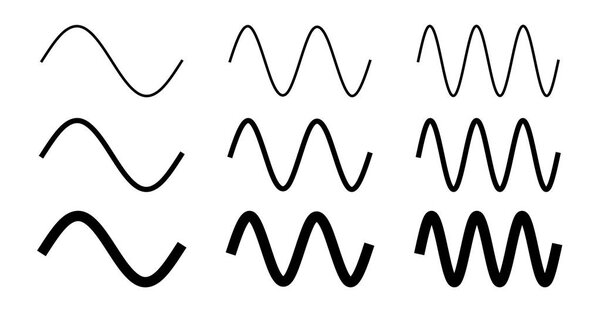 Simple sine wave drawing. One, two and three period with 3 different width.
-
 Five vertical bars template
-
 Quadrant concept diagram logo illustration
-
 Vector mathematical icons
-
 Cartesian Coordinate System With Line.
-
 Descending timeline with rainbow milestones and icons of events
-
 Notes on paper
-
 Trigonometrical system of coordinate
-
 Vector illustration of mathematics functions
-
 Cartesian Coordinate System With Colored Lines.
-
 Statistics outlined flat icons
-
 Cartesian coordinate system icon. Thin linear cartesian coordinate system outline icon isolated on white background from education collection. Line vector sign, symbol for web and mobile
Each vector opens in a new tab with its details. Premium files are sold by Depositphotos; we may earn a commission if you buy. How this works.