Axis diagram vectors
100 axis diagram vector illustrations picked from 16.7M royalty-free files, with no more than 3 per artist so you see real variety. Every file is a scalable EPS that opens in Illustrator, CorelDRAW, Affinity Designer and Inkscape, and exports to SVG or PNG at any size.
-
 Action potential and neuron membrane spike after stimulus outline diagram. Labeled educational scheme with threshold, depolarization, hyperpolarization and repolarization on axis vector illustration.
-
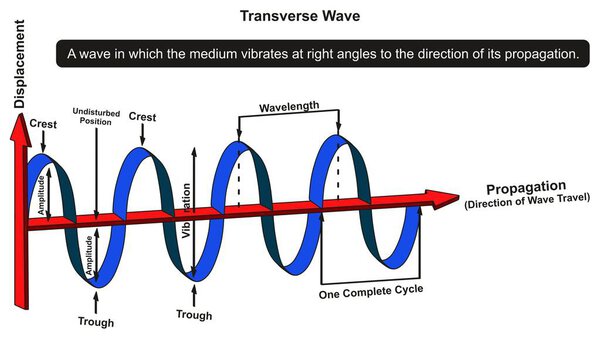 Transverse Wave Infographic Diagram showing structure with displacement and propagation axis with all parts including crest trough amplitude vibration wavelength complete cycle for physics science education
-
 Conflict management with cooperative and assertive axis in outline diagram
-
 Set of scatter plot diagrams. Scattergrams with different types of variables negative correlation. Data points plotted on a horizontal and a vertical axis on Cartesian plane. Vector flat illustration
-
 Kepler Third Law of Planetary Motion Infographic diagram showing sun earth mass semi major axis distance period to complete orbit of planet in solar system astronomy physics science education vector
-
 Set of scatter plot diagrams. Scattergrams with different types of variables correlation. Data points plotted on a horizontal and a vertical axis on Cartesian plane. Vector flat illustration
-
 Kepler First Law of Planetary Motion Infographic Diagram example planet earth elliptical orbit and sun as one foci equation axis aphelion perihelion distance astronomy physics science education vector
-
 Cartesian coordinate system plane chart axis diagram white.
-
 Diagram showing earth axis in dark space
-
 Hypothalamic-pituitary axis overview, hypothalamus, anterior-posterior pituitary, and target glands with hormone routes and feedback loops. Outline diagram
-
 Diagram showing effect on earth axis
-
 Wind turbines and energy rating diagram
-
 Blue line XYZ Coordinate system icon isolated on white background. XYZ axis for graph statistics display. Abstract circle random dots. Vector Illustration
-
 Two math axis empty graphic for presentation
-
 X and y axis Cartesian coordinate plane with numbers with dotted line on white background vector
-
 Line graph infographic template for charts and diagrams
-
 In geometry, an angle connected with an ellipse, with its parts labelled, angle BCL, reckoned from one determinate end, B, of the transverse axis, called the eccentric angle of the point H, vintage line drawing or engraving illustration.
-
 3D Axis colored vector on white background
-
 X and y axis with numbers vector
-
 Graphs of the function of inverse proportionality on the numerical axis, blue for a negative coefficient, red for a positive coefficient
-
 Cartesian coordinate system in the plane in two dimensions. X and Y axises with negative and positive numbers on perpendicular lines. Grid paper background. Vector graphic illustration.
-
 Two axis empty graphic for yours drawing
-
 Side elevation of an Otto engine, the frame being assumed section along the axis of the rod which controls the slide, vintage engraved illustration. Industrial encyclopedia E.-O. Lami - 1875
-
 Flat Icon Chart Set Of Infographic, Statistic, Easel And Other Vector Objects. Also Includes Pie, Easel, Diagram Elements.
-
 Diagram, the arrow and graph on a white background.
-
 Economic finance graphics chart icon. Market sale diagram graph for presentation. Vector
-
 Set Of Graphs, Diagrams And Statistics Icons. Premium Quality Symbol Collection. Icons Can Be Used For Web, App And UI Design.
-
 Growth Diagram Slide Template
-
 Quadrant concept diagram logo illustration
-
 Coordinate Axis Gradient Vector Icon
-
 Vector Illustration Of Logical Symbol On Coordinate Axis Icon. Premium Quality Isolated Increasing Element In Trendy Flat Style.
-
 Crossing the chasm diagram sample
-
 Coordinate Axis Rounded Vector Icon
-
 Thyroid hormones diagram
-
 Wind power industry diagram
-
 Volume diagram on a white background.
-
 Axis icon on white background. Simple element illustration from
-
 Scatter plot color icon. Scattergram. Mathematical diagram. Symbolic representation of information. Chart on coordinate plane. Statistics data visualization. Isolated vector illustration
-
 Endocrine System Image
-
 Trigonometrical system of coordinates on graph paper. vector illustration. template for drawing graphs of trigonometric functions.
-
 Vector illustration of mathematics system of coordinate
-
 Mathematical function Vector Style Black thin line
-
 Triaxial system of coordinate on the grid
-
 Cartesian coordinate system template
-
 Paper infographics template
-
 Timeline with rainbow milestones and event icons
-
 Timeline with rainbow milestones and icons on dark background
-
 Simple Line Chart Slide Template
-
 ���������������������������
-
 Dotted Positive Trend Framed Icon
-
 ���������������������������
-
 ���������������������������
-
 Cartesian coordinate system. vector illustration. template for drawing graphs of trigonometric functions
-
 Vector illustration of Flattening the coronavirus curve for covid-19
-
 Physics, movements of the earth around the sun, formation of the seasons, next generation question template, exam question, eps
-
 Complex Numbers in Polar Form Template vector graphic
-
 Cartesian coordinate system on a notebook sheet on a checkered grid. Vector illustration
-
 Infographic with graph of production growth of potatoes
-
 Integers on number line. Whole negative and positive numbers, zero. Math chart for addition and subtraction operations in school isolated on white background. Vector graphic illustration.
-
 Cartesian plane statistics
-
 Vector illustration - infographic - of primary succession, step by step - ecological succession that begins in essentially lifeless areas.
-
 Leverage formula. Equal weight. Equilibrium of two different objects of the same load. Same distance to fulcrum. Lever in balance. Physics question.
-
 The Globe - World Map with continents and countries. Illustration of the earth - geographic pole, magnetic pole & axial Tilt of the Earth. Earth Temperature, Earth rotation on a white background.
-
 Sp3d2 Hybridization has 1s, 3p and 2d orbitals, that undergo intermixing to form 6 identical sp3d2 hybrid orbitals.
-
 3D Isometric Flat Vector Illustration of Rotation Vs Revolution, Astronomy Science
-
 Analyst, Finance the activities of companies and the results of the economic crisis graph indicator on a
-
 Color graphs variations eps10
-
 Vector illustration - infographic - of secondary succession, step by step - in which plants and animals recolonize a habitat after a major disturbance.
-
 Minimalistic White Graphics on Coordinate System
-
 Various infographics 3d graphs for your business or stock market eps10
-
 Primary succession and ecological growth process concept
-
 Graphics chart in modern flat design.
-
 Vector mathematical icons
-
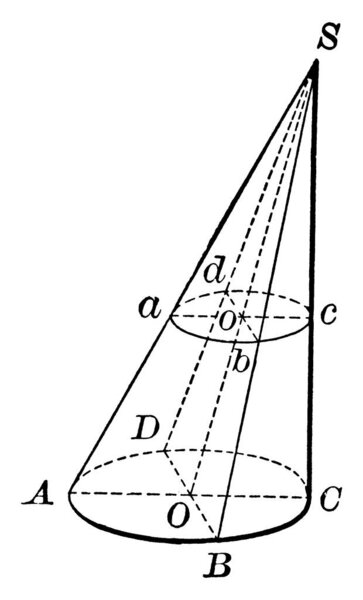 Geometric shape that tapers smoothly from a circular base to a point S called vertex, this shape is also called Cone, vintage line drawing or engraving illustration.
-
 Various symbols of graphs flat blue icons eps10
-
 3D space in the form of a circle with three axes. Simple style cyber element. Geometry symbol logo icon. Detailed vector illustration.
-
 Cartesian Coordinate System In The Plane
-
 A visual representation of the function
-
 GRAPH
-
 Line Graph Representing Data Vector Illustration
-
 Stress responce system
-
 Line Graph Data Presentation Vector Illustration
-
 Coordinate axes. Geometric green cartesian scale with blue analytical system in xyz.
-
 Earth and Sun system. Earth's seasons
-
 Grid chart line icon, grid chart line symbol, grid chart line vector, grid chart line eps, grid chart line image, grid chart line logo, grid chart line flat, grid chart line art design
-
 Doodle drawing growth line chart
-
 Bar graph icon colored symbol. Premium quality isolated line chart element in trendy style.
-
 Descending timeline with rainbow milestones and icons of events
-
 Charts and graphs
-
 Triaxial system of coordinate
-
 Vector hand drawn business chart
-
 Axial tilt of the Earth
-
 Cartesian Coordinate System With Line.
-
 Cartesian Coordinate System With Colored Lines.
-
 Growth chart black simple line vector icon
-
 A wavy graph representing a mathematical function
-
 Cartesian coordinate system in the plane from 0 to 5 on the graph grid paper. Vector.
-
 Cartesian coordinate system icon. Thin linear cartesian coordinate system outline icon isolated on white background from education collection. Line vector sign, symbol for web and mobile
-
 Two color spike chart vector icon from business concept. isolate
-
 Circular momentum (Bolt Stress and Friction in Bolt Connections)
Each vector opens in a new tab with its details. Premium files are sold by Depositphotos; we may earn a commission if you buy. How this works.