Analysis technology graph vectors
100 analysis technology graph vector illustrations picked from 6M royalty-free files, with no more than 3 per artist so you see real variety. Every file is a scalable EPS that opens in Illustrator, CorelDRAW, Affinity Designer and Inkscape, and exports to SVG or PNG at any size.
-
 Financial stock market graph on stock market investment trading, Bullish point, Bearish point. trend of graph for business idea and all art work design. vector illustration.
-
 Business Analysis concept, People work in front of a big laptop. Auditing, Financial consulting flat vector illustration
-
 Business people analytic business graph and SEO on web
-
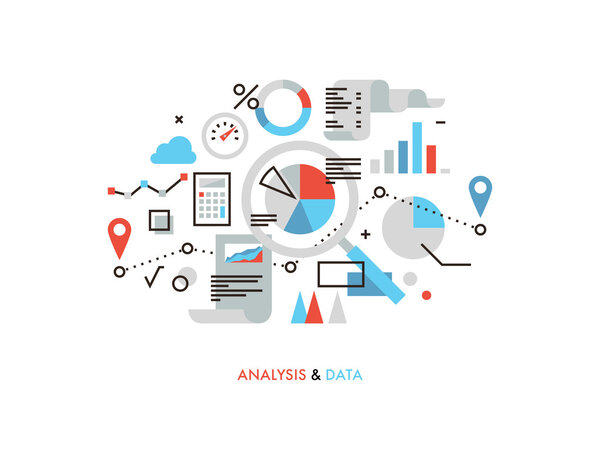 Data analysis flat line illustration
-
 Vector line graph element. Modern simple chart background.
-
 Business financial investment and money graph report on device
-
 Businessman hands holding hologram of growth graph chart. Stock market digital concept. Abstract histogram with up arrow. Low poly wireframe vector illustration in futuristic light blue style.
-
 Rise of AI artificial intelligence, innovation technology to develop growth, success or progress, automation or AI for marketing and financial business concept, robot hand walk up growth graph.
-
 Market analysis
-
 Landing page concept flat isometric illustration. data analysis monitoring team
-
 Set of one hundred technology icons
-
 Business analysis, financial report
-
 Vector illustration concept of data analysis, statistics, business and workflow. Bar chart with tiny working people. Creative design for banner, poster, business presentation.
-
 Analysis Special lineal color icon. Illustration symbol design template for web mobile UI element. Perfect color modern pictogram on editable stroke.
-
 Technology concepts
-
 Set Flat 2D concepts Online chat, data analysis, data collection, digital marketing. For Concept for web design
-
 Flat color Modern Isometric Concept Illustration - Data Analysis
-
 Abstract technology ui futuristic concept hud interface hologram elements of digital data chart, communication, computing and circle percent vitality innovation on hi tech future design background
-
 Business statistics graph with multiple lines
-
 Set of illustrations concept with businessmen. technology, partnership, connection, business robot, cybes. linear illustration Icons infographics. Landing page site print poster. Line story
-
 Business analysis background with magnifying glass, graphs and charts. Analytics report vector infographics.
-
 Work performance, quality control, productive, teamwork, performance evaluation, analysis, planning. Sales assistant, investment, financial growth, performance indicators. Discount, vouchers.
-
 Flat design people concept icons isolated on white. Set of vector illustrations for business, strategy, analysis, planning, time management, marketing, startup, business communication, finance, security.
-
 Business data analysis
-
 Concepts for business analysis
-
 Data analysis icon
-
 Infographic dashboard template with flat design graphs and charts. Processing and analysis of data
-
 Big Data. Business inteligence technology background. Binary code algorithms deep learning virtual reality analysis. Data science learning machine. Artificial intelligence data research and automation
-
 Stock market or forex trading graph. Chart in financial market vector illustration Abstract finance background.
-
 Data analytics representation. Vector laptop with charts and graphs, dashboards and numerical indicators. Dataset flow, processing algorithms and metrics. Financial analysis and AI driven decision
-
 Big data technology. abstract big data background. big data analysis
-
 AI chip with candlestick chart graph with indicator. Stock market, forex trading, financial investment and Artificial Intelligence concept background. Vector illustration
-
 HUD interface, health care and medicine graphs, charts and infographics, vector futuristic medical technology, HUD interface with human body hologram, medical diagnostics and future biomedicine screen
-
 Isometric illustrations concept data analysis teamwork and tools. small people working on laptop computer expand graph and chart for analytics. Vector illustrate.
-
 Business analysis and analytics online through the app. Dashboard app
-
 Big data analytics vector. Future technology concept. Web design. Digital data visualization business concept. Science technology abstract vector background.
-
 Analytics information on Computer. Big data analysis tools. Isometric design modern vector illustration.
-
 Set of web page design templates for data analysis statistics, corporate reports, business presentation and cloud computing services. Concepts vector illustration with flat cartoon characters.
-
 3D isometric analytics and data science concept with Big Data Analysis, data research, technology, digital information chart. Vector illustration eps10
-
 Data analytics landing page. 3d isometric business statistical analysis concept with pie chart, graph, diagram, laptop. Webpage vector template
-
 Data analysis, financial analytics isometric landing page, analyst trader workplace
-
 Big data analytics. big data visualization. artificial intelligence. data analysis concept.
-
 Young team of entrepreneurs engaged in business analysis on a large tablet. Data analysis concept. 3d isometric Concept for web design
-
 Big data analysis abstract background
-
 Concept of data research, technology, data analysis and science. Modern flat design isometric concept. Landing page template.
-
 Business concept teamwork of peoples working development data analytics graph chart. Vector isometric illustrations.
-
 Isometric data analysis technology vector illustration, cartoon 3d research analytics service, programming, development and database optimization
-
 Isometric Investment and virtual finance, marketing management for investment, analysis and planning concept on computer and mobile screen
-
 Big Data Science Analysis Isometric Concept
-
 Banner Software UI and development for different devices. Business App dashboard with graph, charts, analytics data, testing platform, coding process. Software development and programming concept.
-
 Stock market, economic graph with diagrams, business and financial concepts and reports, abstract technology communication concept vector background
-
 Business data analytics infographic, market research, business planning, data visualization, digital data analysis, statistics, for landing page, web banner, web design, presentation
-
 UI interface graphs and charts, infographic elements, futuristic dashboard data diagrams vector templates. Modern dashboard screen with bar, line, circular and timeline graphs, mind map and pie charts
-
 Network Data Analysis for Server Development and Management
-
 Set Flat 2D concepts financial analysis, data collection application, business planning, graphs and charts. For Concept for web design
-
 AI chatbot responding to user queries, emotional feedback icons, data analysis graph, and checklist. Ideal for customer support, automation, data analysis, AI development, productivity digital
-
 Infographic dashboard interface. Admin panel with graphs, chart diagrams, statistic, data visualization. Vector illustration
-
 Financial trade concept. Stock market and exchange. Candle stick graph chart.
-
 Business analytics white poster. Financial literacy and occupation. Laptop with graphs and diagrams. Landing page design. Cartoon isometric vector illustration isolated on white background
-
 Business strategy and planning. Data analysis and investment. Business success. Computer with infographic elements. Design for presentation. Vector illustration
-
 Financial data graph chart background. Business background with candlesticks chart for reports and investment. Financial market trade concept. Vector illustration.
-
 Big data algorithms visualization technologies infographic analy
-
 Set of 20 Technology is a unique illustration. Flat vector illustrations. This illustration really helps your digital needs. You can use this illustration for your website, Trendy vector style.
-
 Data analysis dark neon light isometric web banner vector template
-
 Data Analysis for website
-
 Business candle stick graph chart of stock market investment trading with world map. Stock market and exchange. Stock market data. Trend of graph. Vector illustration for your design
-
 Business analysis technology isometric vector illustration.
-
 Financial analysis, investment strategy, business analytics isom
-
 Intelligent hud interface technology graphic display. Interactive panel on dark blue background with charts, diagrams. Vector data screen, futuristic ui infographic
-
 Modern Isometric Stock Market Financial Analysis Illustration, Suitable for Diagrams, Infographics, Book Illustration, Game Asset, And Other Graphic Related Assets
-
 Data analysis landing page. Statistical analyst team, business growth strategy, statistics concept. Data research web page template vector set
-
 Marketing industry, business analysis concept. Hand holds tablet. Design infographi project, statistics, diagram in screen. Flat style vector illustration.
-
 Analytics information on laptop. Big data analysis tools. Isometric design modern vector illustration.
-
 Business inteligence technology background. Binary code algorithms deep learning. Virtual reality analysis. Data science learning machine. Artificial intelligence data research and automation.
-
 Vector illustration Big data analytics concept landing page. Volume, Value, cloud computing, and Virality. Market research, product testing, data analysis. Flat Line style design
-
 Data analysis concept, modern flat design isometric. Data center query, search engine optimization. Concept of business big data analysis, global analytics
-
 People study dynamic processes in graphs and diagrams. 3d isometric infographics. ESP 10.
-
 Digital stock market analysis concept. An abstract man holds a magnifying glass in his hand and analyzes the graph chart on technological dark blue background. Low poly wireframe vector illustration
-
 Economic graphs and business reports depict a stock market crash with declining financial indicators on a blue technology backgroun.
-
 Data analysis modern flat design isometric concept. Analytics and people concept. Landing page template. Conceptual isometric vector illustration for web and graphic design.
-
 BIG data
-
 Diagram line icons, signs, vector set, outline illustration concept
-
 Mobile charts UI. Phone screen with dashboard analytics, diagrams and bars with stock statistics and forecasts. Financial statement schemas for presentation, vector report templates
-
 Drawing business formulas: chart
-
 Black metal oil barrel
-
 Growth chart with magnifying glass focusing on point
-
 Simple infographic dashboard template
-
 Set of flat design concept icons for web and mobile phone services and apps
-
 Vector illustration of data processing for display on a laptop using a secure network and accessible database. Can be used for landing pages, web, websites, mobile apps, posters, ads, flyers, banners
-
 Abstract infographics visualization
-
 Business concepts.
-
 Stock price increases. traders watch stock price movements. a businessman or analyst analyzes data. observe market data patterns and stock transaction volume. illustration concept design
-
 Illustration of business idea and income side jobs. people looking for additional income and investing with lending or loans provided by banks. can be used for web, website, posters, apps, brochures
-
 Two colleagues are making business report
-
 Market analytic report. Financial audit, marketing strategy review and finance business statistic isometric 3D vector illustration set
-
 Construction sites, optimization, web design, online communication concept. Vector illustration for web design, social media advertising, blogging, presentations.
-
 Online stock exchange, vector flat style design illustration
-
 People business meeting and brainstorm for finance investment planning concept
-
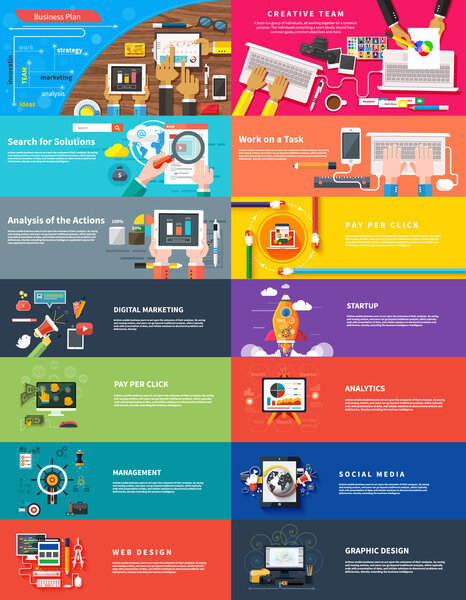 Management digital marketing srartup planning seo
-
 Stock trading strategies
Each vector opens in a new tab with its details. Premium files are sold by Depositphotos; we may earn a commission if you buy. How this works.


