Analysis strategy solution process chart vectors
100 analysis strategy solution process chart vector illustrations picked from 4.1M royalty-free files, with no more than 3 per artist so you see real variety. Every file is a scalable EPS that opens in Illustrator, CorelDRAW, Affinity Designer and Inkscape, and exports to SVG or PNG at any size.
-
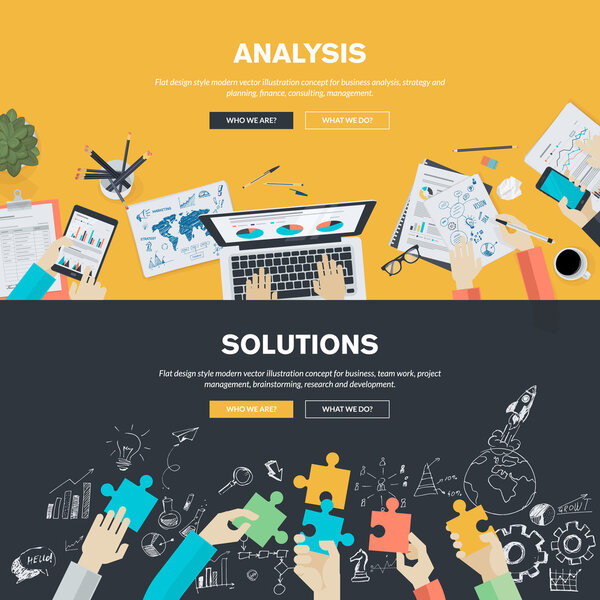 Flat design illustration concepts for business analysis, strategy and planning, finance, consulting, management, team work, project management, brainstorming, research and development
-
 Business Analysis concept, People work in front of a big laptop. Auditing, Financial consulting flat vector illustration
-
 Process chart template 2
-
 Analysis and searching
-
 Strategy concept
-
 Strategic planning concept with people scene in flat design. Woman finds new opportunities, plans strategy for development and profit growth. Vector illustration with character situation for web
-
 Analyzing flow chart
-
 Modern Flat thin Line design Solution and business solutions concept for web banner website, presentation, flyer and poster.
-
 Project management concept. Business analysis, planning, financi
-
 Gap analysis as current and desired performance level outline diagram concept
-
 Performance improvement concept, quality or progress, Process improvement, efficiency to increase productivity, management strategy, businessman pushing gears to improve improvement graphic diagram.
-
 Infographic Marketing Strategies template for business. Modern Timeline 5 step, digital sale marketing data, presentation vector infographics.
-
 Competitor analysis
-
 Data analysis for business insight, intelligence information on marketing research, analytics or data visualization dashboard, project chart and graph concept, businessman analyze data with lightbulb.
-
 Search for solutions infographic
-
 Isometric business data analysis process vector illustration set for mobile website, digital technology, processing, analyzing financial database report
-
 KPI. Businessman standing next to a chart of key performance indicators
-
 Red plane going through workflow challenges one by one. Workflow, working process, project progress, success tracking, work experience idea concept.
-
 Word cloud background concept for business process management (bpm). strategic business analysis, industry implement idea of financial system solution. vector illustration.
-
 Analyze data, financial research analytics, data analysis, chart and graph or diagram, database report or predictive visualization concept, businessman with magnifying glass analyzing pie chart data.
-
 Business data analysis concept, People work in front of a big mobile phone. Auditing, Financial consulting flat vector illustration
-
 Analytics process
-
 STRATEGY mind map
-
 Strategy development. Business planning concept.
-
 Composition On Dark Background. 3D Isometric Vector Design, Cartoon Style. Business Goals Planning Strategy And Rating Assessment Concept. Person Standing Near Smartphone And Work Infographic Items.
-
 Market strategy flat line illustration
-
 Business analysis concept with characters. Auditing, Financial consulting. Can use for web banner, landing page, web template. Flat vector illustration
-
 Businessman and partner present business model on whiteboard. Brainstorm for business idea or plan to achieve goal, management strategy. Flat modern vector illustration.
-
 Time Management or Implementing Business Solutions
-
 This visually engaging SWOT analysis infographic presents key business strategy elements. The SWOT analysis diagram details strengths, weaknesses, opportunities, and threats for strategic planning.
-
 Vector illustration Investment growth, financial increase, development People Research, strategy selection, statistics, planning, marketing, study of performance indicators Business analysis concept
-
 KPI Key performance indicator infographics elements set. Performance, Efficiency, Evaluation, Implementation, Strategy, Goals, Growth, Measurement. Web vector linear icons collection
-
 Hand drawn concept whiteboard drawing - startup strategy
-
 Vector illustration on the subject of data gathering, business intelligence, digital solutions. Editable stroke
-
 Modern swot analysis concept with four options and place for your description. Simple flat template for project data visualization.
-
 Arrow infographic. 5 steps presentation diagram, business workflow process, flow chart with five options. Strategy timeline, information graphic. Vector template.
-
 Isometric data analysis, development marketing vector illustrations with marketer designer people developing, programming and analyzing database content
-
 Management Interactive Analysis
-
 Business plan analytics finance strategy People
-
 Business Plan Vector Illustration with Target, Planning, Workflow, Time Management, Statistical and Data Analysis in Flat Cartoon Background
-
 Key performance indicator banner with icons. Performance, measurement, efficiency, quality, growth, implementation, strategy, objective icons. KPI Business Internet Technology Concept. Web vector infographic in 3D style
-
 Business Economics chart
-
 Strategic Business Development Analysis
-
 Process improvement, efficiency to increase productivity, management strategy, raising performance, quality or progress concept, businessman pushing cogwheels up on rising improvement graph diagram.
-
 Data Analysis Tools
-
 Efficient business management with ERP, CRM, and strategic planning to optimize processes and client relations, concept of Businessman analyzing resource planning software through pie chart
-
 Colorful arrows with data, info, text, cycle circle. Business banner. Background for workflow concept, strategy to success, website, web design. Creative spreadsheet (Infographics) template (layout)
-
 ITSM information technology service management quality management computing systemic solution
-
 Marketing process, Targeting marketing strategy, businessman, marketing strategy,unlocking idea, analyst, business plan, young businessman holding key to unlocking idea, flat vector illustration banner
-
 5 Step Business mountain pyramid infographic ascending Steps success strategy and financial growth process. presentation vector infographics.
-
 Marketing Concept of Product Life Cycle Graph Chart
-
 Business Data Analysis Software Landing Page. Marketing Strategy Development for Market Analyzing by Creative Character. Neural Network Concept for Website or Web Page. Flat Vector Illustration
-
 People interacting with charts and analysing statistics. Data visualisation concept. 3d isometric vector illustration.
-
 Business management with AI tools isometric banner template. Vector illustration for a landing page about finance and automation. Modern technology concept for analysis and accounting
-
 Business and marketing concept in 3d isometric design. People analyzing data on dashboard, developing company, finding solutions for promotion. Vector illustration with isometry scene for web graphic
-
 6 Options Infographic Grid Template with Color Coded Icons for Business Strategy, Workflow, and Data Presentation
-
 Illustration icon with the concept of business process management
-
 Performance Management employee or system review measurement perform analysis optimization of productivity effectiveness vector
-
 AI Implementation Roadmap Infographic Vector. 5 strategic steps from assessment, data infrastructure, pilot project, integration, to monitor and scale. Business tech strategy Presentation Slide.
-
 Process chart template 8
-
 Business Visualization Infographic Design for Presentation or Workflow Layout. Infographic Template Design can be used for Presentations Banner, Process Diagram, or Flow Chart
-
 Character Desktop Chart Analyzing
-
 A vibrant step-by-step process infographic template featuring colorful arrows representing progress through six key steps. This infographic template is ideal for visualizing any multi-stage process.
-
 Web analytics landing page vector template. Big data analysis website design layout. People with laptop graph and charts. Usability testing and user experience 2d concept illustration.
-
 Business banners, colorful arrows with data, figures, numbers, info, interest. Background for workflow concept, step strategy (option), web design. Creative spreadsheet (Infographics) template, layout
-
 Colorful Circular Puzzle Diagram Infographic Vector Design. Gradient Business Pie Chart with Five Segments.
-
 Business trend analysis concept and new business trend project promotion. future prediction analysis. Data analysis, stock market analysis, trader, broker. Flat vector illustration on background.
-
 Analysis of reporting statistics, people are standing by graphs, vector flat illustration.
-
 Hand hold magnify analyze target and chart metaphor of development and market analysis. Business flat vector concept illustration.
-
 Quality control - process by which entities review the quality of all factors involved in production, mind map concept background
-
 Market statistics analysis identify business needs
-
 Financial platform to help choose investment. Statistics data for accounting. Analysis of business data and company growth. Flat vector human illustration for landing page, website, mobile, poster
-
 Marketing Concept of Product Life Cycle Diagram Chart
-
 Simple business process template with five steps. Easy to use for your design or presentation.
-
 Credit Analysis Banner Set
-
 Colourful business wheel chart
-
 Global business strategy icons
-
 Simple business process template with three colorful stages. Easy to use for your design or presentation.
-
 Project Mindmap Chart. Vector
-
 Business strategy planning concept flat vector illustration. Effective management, achieving goal, financial growth.
-
 Business analytics finance growth strategy People
-
 Product management concept of customer technology and business
-
 3D Isometric Flat Vector Conceptual Illustration of ERP - Enterprise Resource Planning.
-
 Vector business and industry gear style circle infographic
-
 Vector flat concept of management, human resources and teamwork. Workforce and development
-
 Businessman hand points to business planning concept
-
 Successful business icons
-
 KPI or key performance indicator outlined measurement vector illustration.
-
 Growth Infographic Icon Set
-
 Business concepts collection
-
 Key performance indicator illustration design concept. Illustration for websites, landing pages, mobile applications, posters and banners
-
 Business ERP development network infographic 3d illustration flat isometric
-
 Risk management infographic Concept Diagram Vector Illustration.Project presentation, Meeting, workflow, Risk management icons
-
 Productivity
-
 Strategic planning, entrepreneur hand on tactical chess king.
-
 Business plan map
-
 Set isometric landing pages, Young people collect and analyze data, make business plans. For website and mobile apps development
-
 Improvement
-
 Circular business infographic template with six steps vector design
-
 MANAGEMENT ICON SET
Each vector opens in a new tab with its details. Premium files are sold by Depositphotos; we may earn a commission if you buy. How this works.
