Analysis strategy graph chart vectors
100 analysis strategy graph chart vector illustrations picked from 3.2M royalty-free files, with no more than 3 per artist so you see real variety. Every file is a scalable EPS that opens in Illustrator, CorelDRAW, Affinity Designer and Inkscape, and exports to SVG or PNG at any size.
-
 Marketing strategy spreadsheet on screen. business finance analysis audit with graphs charts. Return on investment ROI concept. increase profit stretching rising up. banner template illustration
-
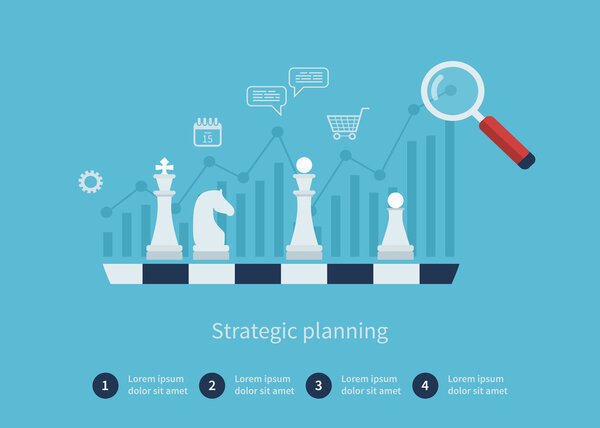 Strategy planning and successful business
-
 Business Strategy, Marketing Solution, Strategic Vision, First Steps To Start New Business. Chess and Chessboard On Board With Target And Light Bulb Icon. 3D Rendering Realistic Vector Illustration.
-
 Small people working around big page with various infographics. Data analysis. Poster, card for presentation, web page, banner, social media. Flat design vector illustration
-
 Business Analysis concept, People work in front of a big laptop. Auditing, Financial consulting flat vector illustration
-
 Strategy & planing icon set vector illustration graphic design
-
 Isometric graph chart vector illustration set, 3d infographic element, diagram bar with stats percent or graphic pie chart isolated on white
-
 Data analysis icon concept
-
 Set of blue-themed financial graphs depicting data trends, including line and area charts. Illustrating business growth and analytics. Concept of economics, financial analytics and growth
-
 Modern flat design isometric illustration of Strategy. Can be used for website and mobile website or Landing page. Easy to edit and customize. Vector illustration
-
 Financial trade concept. Stock market and exchange. Candle stick graph chart.
-
 Business Financial Graph Chart Diagram
-
 Graph Chart Line Icons
-
 Business people working together with graph chart and statistics. vector illustration
-
 Graph chart icon
-
 Strategy of successful business development
-
 SWOT Analysis Strategy Management for Business Plan
-
 Marketing Concept of Product Life Cycle Graph Chart
-
 Digital marketing strategy landing webpage with diagram
-
 Flat 3d Isometric Ai Robot Floating and Analyse Virtual Business Graph Chart. Data Analysis and Artificial Intelligence Concept.
-
 Set of Education icons, such as Line graph, Ranking. Certificate, approved group, save planet. Artificial intelligence, Paper clip, Recovery hdd. Ranking star, Report document, Brand contract. Vector
-
 STRATEGY - LINE ICON
-
 Landing page concept flat isometric illustration. data analysis monitoring team
-
 Strategic planning concept with people scene in flat design. Woman finds new opportunities, plans strategy for development and profit growth. Vector illustration with character situation for web
-
 Confident business woman uses interactive screen makes report to a group of meeting, she shows statistics, growth and analysis. Hand drawn in thin line style, vector illustrations.
-
 Strategy concept
-
 Analyzing flow chart
-
 Computer Monitor with Voice Graph. Online Business Presentation, Training or Seminar, Virtual Financial Consultation
-
 Tiny Business Characters with Huge Golden Coin near Grow Chart. Investment Strategy and Portfolio Analysis, Investment
-
 Businessman holding bar and pie chart. Financial report, marketing, analytics, statistics, research data, business analysis. Flat cute outline cartoon isolated vector illustration
-
 Continuous line drawing of office worker analyzing growing graph on computer screen
-
 Business Woman Character Doing Presentation, Giving Financial Consultation Stand at Whiteboard with Data Analysis Chart, Mindmap Graph, Financial School Seminar in Office. Cartoon Vector Illustration
-
 Market analytic report. Financial audit, marketing strategy review and finance business statistic isometric 3D vector illustration set
-
 Business analysis background with magnifying glass, graphs and charts. Analytics report vector infographics.
-
 Lineo Editable Stroke - Diagrams and Graphs line icons
-
 Vector illustration concept of data analysis, statistics, business and workflow. Bar chart with tiny working people. Creative design for banner, poster, business presentation.
-
 Green Business Charts and Graphics Set. Vector
-
 Analysis Special lineal color icon. Illustration symbol design template for web mobile UI element. Perfect color modern pictogram on editable stroke.
-
 Business success strategy target
-
 Set Flat 2D concepts Online chat, data analysis, data collection, digital marketing. For Concept for web design
-
 Flat color Modern Isometric Concept Illustration - Data Analysis
-
 Business success strategy
-
 Business analysis icon illustration
-
 Line Graph Data Presentation Vector Illustration
-
 Set of colored business graphs
-
 Strategy planning, business
-
 Stock trading strategies
-
 Business analysis and planning strategy
-
 Research & Analysis Doodle Icons
-
 Business data analysis
-
 Business plan or investment vector concept. Businesswoman drawing increasing graph. Symbol of successful investment, profit, finance, growth, strategy.
-
 Magnifying Glass and Multicolored Pie Chart
-
 Business planning, strategy of growth and profit vector concept. Businessman painting chart. Symbol of success, profitable investment, future.
-
 Flat design people concept icons isolated on white. Set of vector illustrations for business, strategy, analysis, planning, time management, marketing, startup, business communication, finance, security.
-
 Set of infographic options vector design template. Can be used for workflow layout, data visualization, business concept with 10 options, parts, steps or processes, banner, diagram, chart, web design.
-
 Accounting and finance auditing concept, calculating budget, profit and loss, generating report graph from data, professional, business person accountant with calculator, spreadsheet creation report.
-
 Competitor analysis
-
 Investment analysis concept banner with characters. Can use for web banner, infographics, hero images. Flat vector illustration isolated on white background. Illustration with small people
-
 Strategy management improvement template
-
 Financial strategy, background image, monitor with charts and graphs, image projection, stock candles
-
 Growth and Analysis Vector Icon Design
-
 Candlestick chart, trade advisor concept. Vector illustration.
-
 Gap analysis as current and desired performance level outline diagram concept
-
 Candlestick. Trading graphic. Stock market graph. Financial chart. Investment in forex indicators. Abstract background. Flat style vector illustration.
-
 SEO Marketing strategies in PC monitor
-
 Applied Stakeholder analysis strategy model infographic diagram chart banner template with icon vector for presentation has listing, mapping, ranking, categorizing, visual tool to analyze stakeholders based on power and interest. Prioritize engagemen
-
 Calculator and business report with rising graph. Vector illustration.
-
 Concept of increasing income or salary, growth of investment profit or income from stock market, growth of money or wages, businessman with magnifying glass on dollar sign with growth charts and graphs.
-
 Business team analysis and monitoring concept on web report dashboard monitor. data analysis research flat vector illustration design for business financial planning concept, flat vector illustration.
-
 Analysis word cloud
-
 Investment strategy, business analytics, financial performance i
-
 Analysis tag cloud
-
 Market segmentation presentation template vector illustration with icons has 4 process such as Geographic, Psyhographic, Behavioral and Demographic. Marketing analytic for target strategy concepts.
-
 Sales plan for business, find leads, product strategy concept with tiny people. Marketing plan abstract vector illustration set. Budget growth, brand awareness, target group metaphor.
-
 Set Flat 2D concepts financial analysis, data collection application, business planning, graphs and charts. For Concept for web design
-
 Abstract background of relative strength index (RSI) stock market chart graph on white background
-
 Gap analysis method to assessing business performance outline diagram
-
 Market strategy flat line illustration
-
 The team is brainstorming, working with data in the form of various charts, looking for new investments. A set of fun vector illustrations on the theme of business and group work.
-
 Marketing Strategy illustration which can easily edit and modify
-
 Digital business candle stick chart graph. Financial investment, stock market and forex trading concept background. Vector illustration.
-
 Infographic Marketing Strategies template for business. Modern Timeline 5 step, digital sale marketing data, presentation vector infographics.
-
 KPI tracking, assessing metrics analysis concept vector illustration. Business analyst monitoring key performance indicators on dashboard
-
 Analysis
-
 Service Overview 3 Step Graph Frame Template. Minimalist Briefing Slide Layout Vector Illustration. Consulting Insight Three Option Infographic Presentation Design.
-
 Swot analysis infographic design with four colorful elements concept
-
 Flat modern vector concept Data Driven Strategy banner with icons and text.
-
 Business strategy Concept. Businessman standing in front of big laptop screen and looks at growth statistics. Success in the business. 3d isometric flat design. Vector illustration
-
 Business strategy planning concept. Developed economic management.
-
 Risk matrix chart. Infographics for assessing data strategy with process management and diagram of safe decisions with the probability of vector impacts
-
 Isometric business data analysis process vector illustration set for mobile website, digital technology, processing, analyzing financial database report
-
 Online marketing plan, concept planning, graph, chart, cog, drawn on paper, data analysis to goal, red graph, isometric, vector illustration
-
 Digital Marketing Dashboard Strategies for Analysts
-
 Ansoff Matrix strategic planning tool framework infographic diagram chart banner with icon vector template for slide presentation has market penetration, Product or market expansion grid strategy plan
-
 Modern data analysis, office work and time management illustration
-
 Investment strategies and portfolio management
-
 Investment strategy, financial success, management. Income chart, profit growth steps, money, documents, winner's cup. Can use for web banner, landing page, web template.
-
 Businesspeople Characters, Office Employees Data Analysis, Project Management App, Consulting, Social Media Marketing
-
 Vector infographic for strategy process visualization template with head and gear as main symbol, isolated on light background. Easy to use for your website or presentation.
-
 Business Charts Icon Pattern Background
Each vector opens in a new tab with its details. Premium files are sold by Depositphotos; we may earn a commission if you buy. How this works.