Analysis financial graph vectors
100 analysis financial graph vector illustrations picked from 5.6M royalty-free files, with no more than 3 per artist so you see real variety. Every file is a scalable EPS that opens in Illustrator, CorelDRAW, Affinity Designer and Inkscape, and exports to SVG or PNG at any size.
-
 Businesspeople Banking Accountant Finance Business Data Analysis Financial Graph
-
 Pie chart with segments, wallet holding cards, and graph with target point. Ideal for finance, data analysis, budgeting, payments, financial goals, consumer behavior abstract line flat metaphor
-
 Analysis financial results finance business chart graph diagram statistic concept top angle view desktop laptop paper documents report office stuff horizontal
-
 Balance sheet, analysis, financial, growth, graph concept. Hand drawn isolated vector.
-
 Vector business template with illustration of financial graph and chart on white background with word financial analysis. Flat style creative design with text space for web, site, banner
-
 Set of Stock analysis, Column chart and Candlestick graph icons. Buying sign. Business trade, Financial graph, Finance chart. E-commerce shopping. 3d isometric buttons. Flat design concept. Vector
-
 Digital isometric design concept set of financial analyst app 3d icons.Isometric business analysis financial analytics infographics,graphs,dollar coin,diagram on landing page banner web online concept
-
 Digital isometric design concept set of internet analyst app 3d icons.Isometric business analysis financial analytics infographics,graphs,cogwheel,diagram on landing page banner web online concept
-
 Data analysis landing page vector template. Information chart and graph website header UI layout with isometric illustration. Accounting report, financial presentation web banner isometry concept
-
 Financial Graph Chart
-
 Financial stock market graph on stock market investment trading, Bullish point, Bearish point. trend of graph for business idea and all art work design. vector illustration.
-
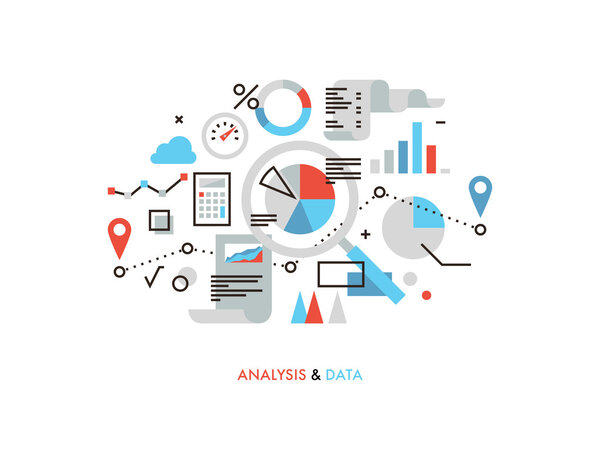 Data analysis flat line illustration
-
 Financial Infographic set with charts
-
 Laptop with charts and graph on screen on blue background. Analysis business accounting concept. Vector illustration design
-
 Business investment and stock market graph going uptrend, concept of growing upside share market
-
 Business analysis, financial report
-
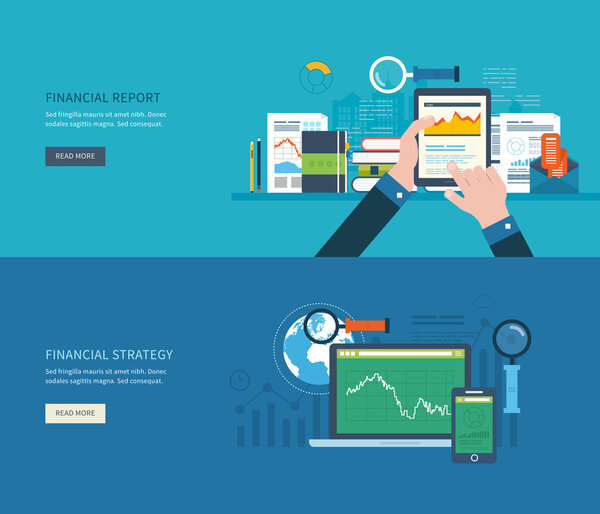 Analyzing project, financial report
-
 Financial Report Doodle Concept
-
 Business Graphs & Charts Icons Set 2 - Black Version
-
 Business Analysis concept, People work in front of a big laptop. Auditing, Financial consulting flat vector illustration
-
 Vector Background with Graphs
-
 Data dashboard with charts and graphs, large dollar coin, and bitcoin graphic with digital nodes. Ideal for finance, cryptocurrency, data analysis, trading, investment, fintech abstract line flat
-
 Business people and women make financial. Analyzing financial graphs and charts using a tablet. Man and woman saving in piggy bank. Investment concept. Set flat vector illustration.
-
 Data analysis icon
-
 Business Graphs & Charts Icons Set 1 - Black Version
-
 Data analysis logo design with magnifying glass for data finance, investment vector icon design
-
 Business Graphs & Charts Icons
-
 Business Graphs & Charts Icons - Blue Series
-
 Concepts for business analysis
-
 Bar chart icon. Flat chart related icon for web and mobile applications. Business graph icon. Flat illustration of business graph icon for web design
-
 Accounting and financial logo design template. Finance business logo design
-
 Set of blue-themed financial graphs depicting data trends, including line and area charts. Illustrating business growth and analytics. Concept of economics, financial analytics and growth
-
 Mobile charts UI. Phone screen with dashboard analytics, diagrams and bars with stock statistics and forecasts. Financial statement schemas for presentation, vector report templates
-
 Business Graphs & Charts Icons - Dot Series
-
 Includes elements such as a financial graph, shopping speech bubble, and currency symbol. Ideal for online shopping, financial analytics, e-commerce, economic reports, web design. Banner for landing
-
 Financial graph chart. Business data analytics. Diagram growth and success in business. vector
-
 Chart Analysis Flat Vectors Pack
-
 The company's business graph fluctuates and is unstable over time
-
 3D Earth Globe with graphics and charts. World business and economics concept. Stock market, forex and world investment. Financial investment and economic trends. Vector illustration
-
 Business Financial Graph Chart Diagram
-
 Financial Graph Diagram Chart Desktop Computer Workplace, Finance Concept 3d Isometric Workplace
-
 Mobile stock trading concept with candlestick and financial graph charts on screen, Global network connection and wireless technology allows investors to access trading platforms from their telephone.
-
 Flat design illustration concepts for business analysis, financial report, consulting, team work, project management and development.
-
 Laptop concept - top view - financial graph on display
-
 Trader work place, analyzing exchange chart candlestick. Analysis financial growth, banking analytical diagramm. Trading workplace table. Vector illustration
-
 Business man standing on financial graph report monitor concept
-
 Neon lights. Set of Column chart, Sales diagram and Shopping icons. Banking money sign. Financial graph, Sale growth chart, Add to cart. Cash finance. Glowing graphic designs. Vector illustration.
-
 Flat design illustration concepts for business analysis, financial report, consulting, team work, project management and development.Time is money concept.
-
 Set of Column chart, Report document and Discount offer icons. Shield, Queue and Lift signs. Financial graph, Page with charts, Gift box. Protection or security, People waiting, Elevator. Vector
-
 Businessmen discussing market analysis.
-
 Business women analyzing financial data.
-
 Cartoon business specialists analyzing financial data. Isometric illustration
-
 Market analysis flat line icon
-
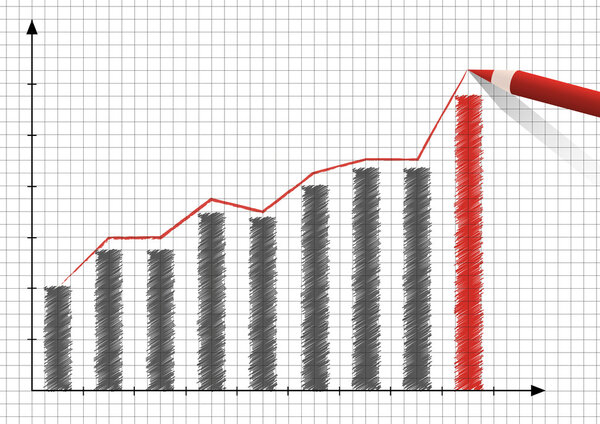 Graph up
-
 Concept of business profit, income business, startup, money, growth, developing your business, setting goals for financial success, investment growth, flat vector illustration banner.
-
 Rising graph simple web icon
-
 Business graph with arrow vector illustration
-
 Business statistic web design with people characters. Analytic team analyzing data scene. Financial research composition in flat style. Vector illustration for social media promotional materials.
-
 Big data analysis isometric landing page. Analyst analyzes statistics isometry concept. Business development and optimization 3d web banner. Vector illustration with people characters in flat design
-
 Flat Line Design Header - Financial Report
-
 Finance and engineering graph of economics. Statistic and sales manager for financial management concept. Economic infographic banner. Flat isometric concept with characters vector illustration.
-
 Forex stock market investment trading concept, Candlestick pattern with bullish and bearish is a style of financial chart.
-
 Financial statistics, analysis, business report vector concept
-
 Vector of business people financial analysts working as a team to achieve a company success
-
 Computer Monitor with Voice Graph. Online Business Presentation, Training or Seminar, Virtual Financial Consultation
-
 Stock Market Graph
-
 Tiny Business Characters with Huge Golden Coin near Grow Chart. Investment Strategy and Portfolio Analysis, Investment
-
 Businessman holding bar and pie chart. Financial report, marketing, analytics, statistics, research data, business analysis. Flat cute outline cartoon isolated vector illustration
-
 Market analytic report. Financial audit, marketing strategy review and finance business statistic isometric 3D vector illustration set
-
 Financial Graph
-
 Piggy bank with bitcoin vector cartoon outline illustration on background of rising bar graph. Money savings concept.
-
 Analysis Special lineal color icon. Illustration symbol design template for web mobile UI element. Perfect color modern pictogram on editable stroke.
-
 Set Flat 2D concepts Online chat, data analysis, data collection, digital marketing. For Concept for web design
-
 Business concept - retro magnifying glass, data analysis
-
 Graphs and charts vector set
-
 Flat color Modern Isometric Concept Illustration - Data Analysis
-
 Computer with stocks graphs and money vector illustration, flat cartoon pc monitor with stock charts growth arrow on screen, concept of success financial trading profit, good markets strategy income
-
 Business analysis background with magnifying glass, graphs and charts. Analytics report vector infographics.
-
 Business data analysis
-
 Bar financial data graph. Forex stock crypto currency trading pattern.
-
 Vector growing graph chart background.
-
 Business report, financial statistic, management, analytics vector concept
-
 Abstract background of stock market Investing Insights with magnifying glass and indicator technical analysis graph
-
 Technical Analysis Of Exchange Trade, stock market or stock exchange vector illustration
-
 Candle stick graph chart of stock market investment trading, Bullish point, Bearish point. trend of graph vector design.
-
 Flat isometric concept illustration. business development analysis data
-
 Illustration of stock market losses. Bankrupt financial information concept with arrows pointing down. Descending trading graph
-
 Accounting and finance auditing concept, calculating budget, profit and loss, generating report graph from data, professional, business person accountant with calculator, spreadsheet creation report.
-
 Calculating Business Technology Data Analysis
-
 Concept illustration of isometric computer data analysis
-
 Business financial blue abstract background with uptrend candle stick pattern of stock market, investment growth success finance business chart
-
 Stock market or forex trading graph chart suitable for financial investment concept. Economy trends background for business idea. Abstract finance background. Vector illustration
-
 Financial investment, analytics with growth report.
-
 Eye-catching abstract financial stock market chart featuring colorful candlestick patterns, symbolizing market trends and financial analysis - vector illustration
-
 Isometric Expert team for Data Analysis, Business Statistic, presentation and brainstorming to strategy planning making profit of company.
-
 Isometric graph chart vector illustration set, 3d infographic element, diagram bar with stats percent or graphic pie chart isolated on white
-
 Barrel of oil price chart vector illustration in flat style. Stock graph on laptop screen.
-
 Business candle stick graph chart of stock market investment trading on blue background. Bullish point, up trend of graph. Economy vector design.
-
 Financial statistics, business report, modern infographic, trends analysis
-
 Isometric business analysis with chart and graphics. Vector of business chart data, graphic analysis illustration
Each vector opens in a new tab with its details. Premium files are sold by Depositphotos; we may earn a commission if you buy. How this works.