Analysis chart management vectors
100 analysis chart management vector illustrations picked from 8.1M royalty-free files, with no more than 3 per artist so you see real variety. Every file is a scalable EPS that opens in Illustrator, CorelDRAW, Affinity Designer and Inkscape, and exports to SVG or PNG at any size.
-
 Business People Characters at Huge Statistics Chart, Office Employees Data Analysis, Project Management, Consulting, Marketing
-
 Business Analysis concept, People work in front of a big laptop. Auditing, Financial consulting flat vector illustration
-
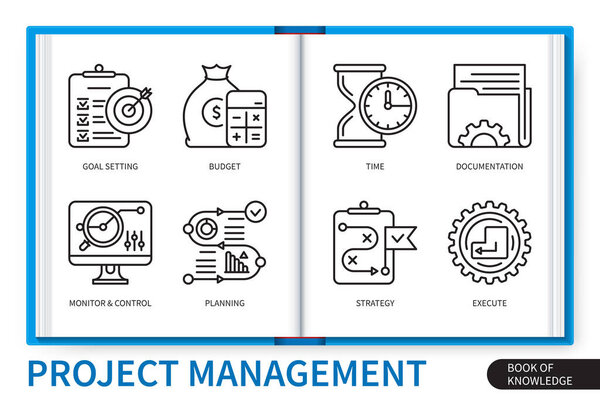 Project management infographics elements set. Goal Settings, Planning, Monitor and Control, Tasks, Budget, Strategy, Execute, Documentation. Web vector linear icons collection
-
 Financial Infographic set with charts
-
 Drawing business formulas: chart
-
 Growth chart with magnifying glass focusing on point
-
 Outline Data analysis, chart, diagram vector simple icons for web and mobile design pack 3
-
 Data analysis, chart, diagram vector simple icons for web and mobile design pack 2
-
 Outline Data analysis, chart, diagram vector simple icons for web and mobile design pack 4
-
 Business man employee analytics data vector advice workshop illustration. Office people analysis chart development. Concept work job network banner. Online cooperation report cartoon
-
 Market analysis flat line icon
-
 Analysis symbol with magnifying glass
-
 Data analytics dashboard icon combining pie and bar charts, a semicircular gauge, and a donut chart with pencil for reporting and data visualization.
-
 Big data analysis isometric landing page. Analyst analyzes statistics isometry concept. Business development and optimization 3d web banner. Vector illustration with people characters in flat design
-
 Calculating and planning budget, management of personal finance. Man stands near stack of money and calculator. Person analyzing business profit report, financial bill. Counting income and expenses
-
 Infographics vector illustration. Flat tiny data charts persons concept.
-
 Analyzing flow chart
-
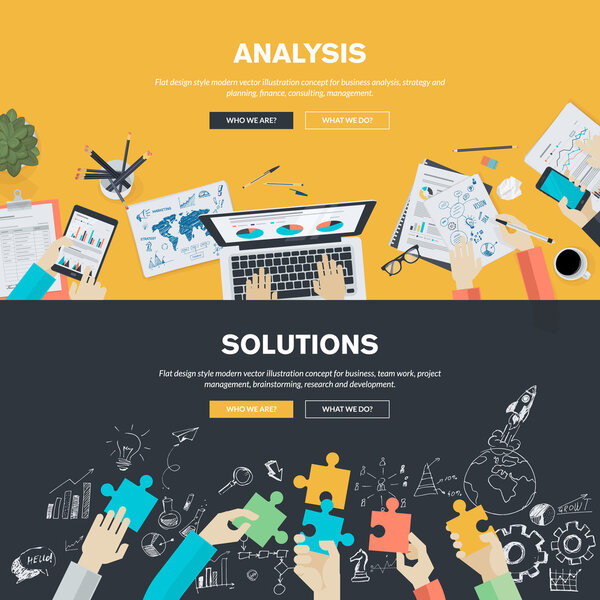 Flat design illustration concepts for business analysis, strategy and planning, finance, consulting, management, team work, project management, brainstorming, research and development
-
 Tiny Business Characters with Huge Golden Coin near Grow Chart. Investment Strategy and Portfolio Analysis, Investment
-
 Project management concept.
-
 Business Analysis symbol with magnifying glass icon
-
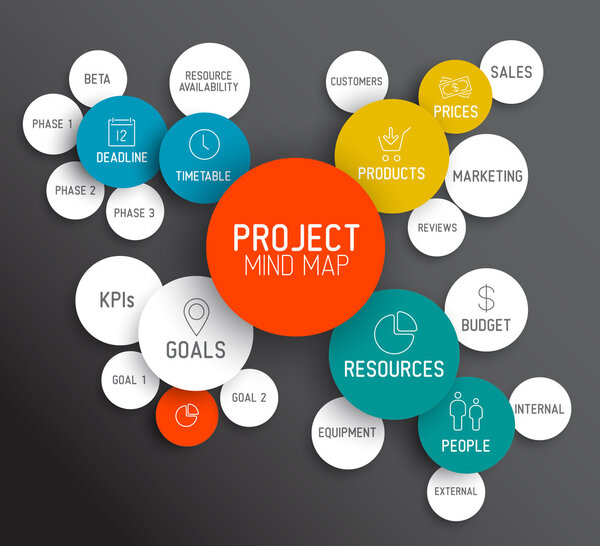 Project management mind map scheme
-
 Analysis Special lineal color icon. Illustration symbol design template for web mobile UI element. Perfect color modern pictogram on editable stroke.
-
 Concepts for business analysis and planning
-
 Data analysis concept
-
 Flat color Modern Isometric Concept Illustration - Data Analysis
-
 Abstract ladder presentation. Monitor collection. Performance of simple designer building monitor chart. Flat color icons, creative illustrations, isometric infographic images, web banner
-
 Flat line design website banner of business research and analysis
-
 Business analysis background with magnifying glass, graphs and charts. Analytics report vector infographics.
-
 Business analysis and planning strategy
-
 Business management concept, Interaction hands using mobile apps
-
 Financial administration concept. Consulting for company performance, analysis concept. Statistics and business statement. Flat isometric infographics for banner or business hero images.
-
 Big Data Analysis Strategy Concept. Marketing Analytics with Business People Characters Working Together with Diagrams and Graphs. Vector illustration
-
 Business data analysis
-
 Flat design people concept icons isolated on white. Set of vector illustrations for business, strategy, analysis, planning, time management, marketing, startup, business communication, finance, security.
-
 Project management concept. Business analysis, planning, financi
-
 Magnifying Glass and Multicolored Pie Chart
-
 Business Analysis symbol with magnifying glass icon and pie chart.
-
 Project management process scheme
-
 Project Management plan.Gears Infographics.Operation planning
-
 Flat design of auditing, analysis, data, accounting, planning, management, research, calculation, reporting, project management, tax process.
-
 Business team analysis and monitoring concept on web report dashboard monitor. data analysis research flat vector illustration design for business financial planning concept, flat vector illustration.
-
 Company analysis chart
-
 Data analysis design concept. Analysis working. Small people with data analysis graphs ansd charts. Vector illustration.
-
 Dashboard analytic character men collaboration analyzing statistic chart with outline style vector design illustration
-
 Investment analysis concept banner with characters. Can use for web banner, infographics, hero images. Flat vector illustration isolated on white background. Illustration with small people
-
 Modernizing Business Process, Financial Analysis
-
 Project management flow set pack bundle collection with PDCA lifecycle, gantt chart, kanban board, and DMAIC model framework infographic with 4 options for slide presentation vector
-
 KPI key performance indicator. Vector illustration. Financial metrics provide snapshot of business health Management often focuses on optimization of performance indicators Statistics are key
-
 Strategy management improvement template
-
 Isometric business analysis. People work with data charts, statistics graph and metrics on computer screen. Finance analytics vector concept
-
 Business analysis. Data analytics of graphs and charts, marketing research.
-
 KPI tracking, assessing metrics analysis concept vector illustration. Business analyst monitoring key performance indicators on dashboard
-
 VMOST Analysis - tool that allows a business to evaluate its core strategies in terms of whether the supporting activities of that strategy are being carried out, pyramid concept for presentations
-
 Isometric business data analysis process vector illustration set for mobile website, digital technology, processing, analyzing financial database report
-
 A vector illustration of the Stakeholder Analysis matrix is a step in Stakeholder Management for supporting analysis between power and interest grid for monitoring, satisfying, managing, informing
-
 Gap analysis as current and desired performance level outline diagram concept
-
 Data analytics landing page. 3d isometric business statistical analysis concept with pie chart, graph, diagram, laptop. Webpage vector template
-
 Business data analytics design concept. people standing on the report graph dashboard background. flat vector design finance investment analysis concept
-
 Business investment data analysis smartphone
-
 Illustration isometric concept. investment business analysis data
-
 Agile methodology life cycle diagram scheme infographics with analysis, planning, design, development, testing, review and launch.
-
 Isometric business analysis with chart and graphics. Vector of business chart data, graphic analysis illustration
-
 Business team analytics concept illustration. Data analysis and statistics. Vector flat illustration
-
 Man with statistical data. Infographic presented in the form of digital graphs and charts on tablet. Financial analysis business concept on screen. Sales statistics. Vector illustration, isometric.
-
 KPI key performance indicator. Vector illustration. KPIs serve as metaphor business goals and objectives A performance indicator chart cvisually represent progress Strategy measurement involves both
-
 Financial management landing page illustration concept. This design can be used for websites, landing pages, UI, mobile applications, posters, banners
-
 Business planning work, time management, HR set
-
 Competitor analysis chart
-
 Vector illustration Investment growth, financial increase, development People Research, strategy selection, statistics, planning, marketing, study of performance indicators Business analysis concept
-
 Sales staff concept. marketing or investment professional, earn profit or sales commission money, successful growth planning or financial adviser, businesswoman holding dollar with growth chart.
-
 Data Analytics Management. Data Analyse. Landing Page Template. Vector illustration
-
 Data analysis landing page. Statistical analyst team, business growth strategy, statistics concept. Data research web page template vector set
-
 Business consulting team. People with financial charts. Business planning, data processing and analysis. Isometric landing page template. Flat vector illustration
-
 KPI. Businessman standing next to a chart of key performance indicators
-
 Isometric illustrations concept data analysis teamwork and tools. small people working on laptop computer expand graph and chart for analytics. Vector illustrate.
-
 Sales performance modern flat concept for web banner design. Man analyzes company financial data and makes presentation, accountancy and management. Vector illustration with isolated people scene
-
 Performance improvement concept, quality or progress, Process improvement, efficiency to increase productivity, management strategy, businessman pushing gears to improve improvement graphic diagram.
-
 Landing page concept flat isometric illustration. data analysis monitoring team
-
 Simple infographic for business analysis with two stages. Flat diagram with minimalistic icons for comparison of 2 options.
-
 Analysis word cloud
-
 Customer analysis chart
-
 Website SEO and analytics icons
-
 Business people analytic business graph and SEO on web
-
 Flat vector illustration of web analytics information and development website statistic
-
 SWOT Strengths Weaknesses Opportunities and Threats Business Ana
-
 Set of Medical Health Care Center.
-
 Fishbone diagram Ishikawa methodology infographic with measurements, materials, personnel, environment, methods, machines. Colored scheme of cause and effect method for managers.
-
 Flat vector illustration of web and application optimization, programming, design and analytics
-
 Data science concept with people scenes set in flat design. Women and men analyzing information, scientist working with databases at graphs. Vector illustration visual stories collection for web
-
 Business concepts.
-
 PROJECT PLANNING CONCEPT
-
 Business analytics concept theme. Vector illustration
-
 Set of thin line icons of investment. Outline symbol collection. Editable vector stroke. 256x256 Pixel Perfect scalable to 128px, 64px...
-
 BIG data
-
 Investigation, business document, research concept
-
 Two colleagues are making business report
-
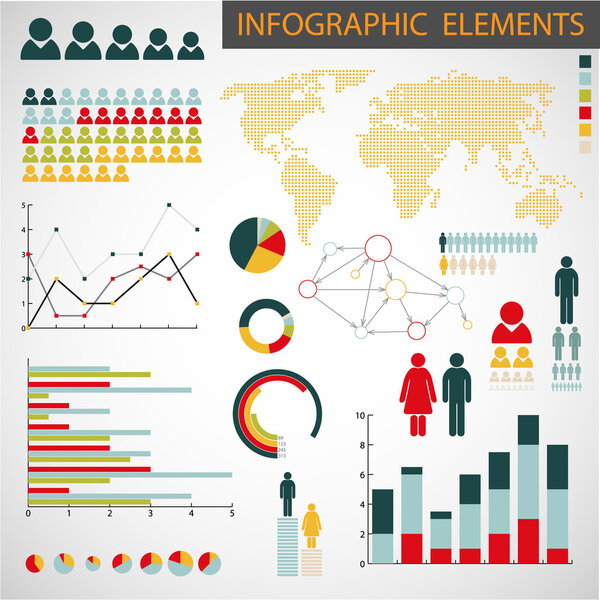 Vector set of Infographic elements
-
 SEO optimization,web analytics, programming process
-
 Marketing, presentation, data statistics market report
Each vector opens in a new tab with its details. Premium files are sold by Depositphotos; we may earn a commission if you buy. How this works.