Analysis chart graph vectors
100 analysis chart graph vector illustrations picked from 8.5M royalty-free files, with no more than 3 per artist so you see real variety. Every file is a scalable EPS that opens in Illustrator, CorelDRAW, Affinity Designer and Inkscape, and exports to SVG or PNG at any size.
-
 Chart graph icon in comic style. Arrow grow cartoon vector illustration on white isolated background. Analysis splash effect business concept.
-
 Analysis financial results finance business chart graph diagram statistic concept top angle view desktop laptop paper documents report office stuff horizontal
-
 Business and finance, analysis, analytics, optimization, statistics, seo, marketing, chart, graph,
-
 Modern 3d pie chart graph vector element in isometric style with soft color gradients. Data visualization concept for analysis, report, presentation, infographics.
-
 Infographic dashboard template with flat design graphs and charts. Processing and analysis of data
-
 Business analysis background with magnifying glass, graphs and charts. Analytics report vector infographics.
-
 Infographic chart vector template. Annual statistics curve graph design. Market data diagrams. Graphic information visualization and analysis. Statistical indicators and frequency of data changes
-
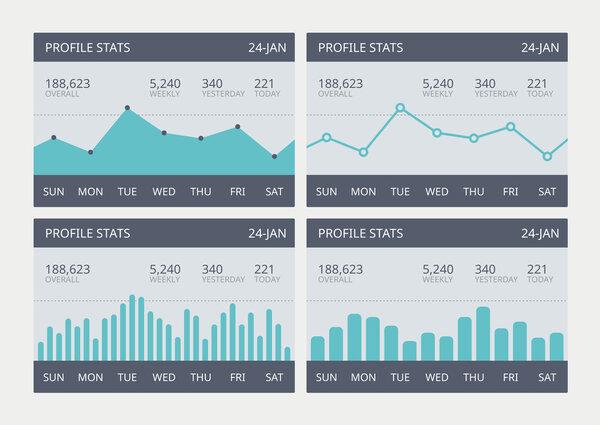 Vector business statistic charts set
-
 Vector Background with Graphs
-
 Data analysis flat line illustration
-
 Financial Infographic set with charts
-
 Digital market, finance bank, business rating vector infographics. Graphic design elements set. Histogram and diagram, radial bar, dot matrix, area, pie charts, line graph, choropleth dot world map.
-
 Charts vector set.
-
 Financial stock market graph on stock market investment trading, Bullish point, Bearish point. trend of graph for business idea and all art work design. vector illustration.
-
 Diagram graph Pie chart.
-
 Small people working around big page with various infographics. Data analysis. Poster, card for presentation, web page, banner, social media. Flat design vector illustration
-
 Business Analysis concept, People work in front of a big laptop. Auditing, Financial consulting flat vector illustration
-
 Stock market charts and graphs
-
 Bar Graph Vector Icon
-
 Business people analytic business graph and SEO on web
-
 Financial Graph Chart
-
 Set of blue-themed financial graphs depicting data trends, including line and area charts. Illustrating business growth and analytics. Concept of economics, financial analytics and growth
-
 Drawing business formulas: chart
-
 Analysis Vector Glyph Two Color Icon For Personal And Commercial Use
-
 Mobile charts UI. Phone screen with dashboard analytics, diagrams and bars with stock statistics and forecasts. Financial statement schemas for presentation, vector report templates
-
 Rising graph simple web icon
-
 Business infographic and diagram vector collection with colorful shapes. Data visualization and chart bar template set design with geometric shapes. Flat business presentation graph chart bundle.
-
 Growth chart with magnifying glass focusing on point
-
 Outline Data analysis, chart, diagram vector simple icons for web and mobile design pack 3
-
 Data analysis, chart, diagram vector simple icons for web and mobile design pack 2
-
 Vector business graph
-
 Outline Data analysis, chart, diagram vector simple icons for web and mobile design pack 4
-
 3D Cute cartoon mobile smart phone with statistics finance chart graph analytics. Business graph. Business invest development concept. Vector illustration.
-
 Modern modern infographic vector template with statistics graphs and finance charts. Diagram template and chart graph, graphic
-
 Market analysis flat line icon
-
 Bar chart graph background, concept of stock exchange vector illustration
-
 Pie chart graph on a computer screen
-
 Triangle, pyramid chart, graph icon series
-
 Businessman drawing business analysis chart and businessman at desk vector illustration.
-
 Business Man Showing Finance Chart Graph Report
-
 Hold Report document line icon. Abstract vector button. Analysis Chart or Sales growth sign. Statistics data symbol. Document line icon. Protect shield concept. Vector
-
 Virus, bacteria and schedule, chart, graph on monitor (board) line, linear icon, symbol, sign. coronavirus, COVID-19 icon, logo black on white background. 2019-ncov simple
-
 Web traffic analysis chart, report summary vector illustration
-
 Protection Secure Data Access Flat vector illustration concept. Man looks at chart graph analyzes statistics of shield protected profile.
-
 Report document line icon. Analysis Chart or Sales growth sign. Statistics data symbol. Minimal line illustration background. Report document line icon pattern banner. Vector
-
 Jewish Business Man Showing Finance Chart Graph Report
-
 Forex trading landing page vector illustration. Laptop with trading candlestick chart, graph graphic design. Landing page template for fintech projects.
-
 Bar Chart Colored Vector Icon
-
 Analysis Chart Colored Illustration Vector Icon
-
 Data Analysis Chart Landing Page Vector Character
-
 Vector line graph element. Modern simple chart background.
-
 Analysis symbol with magnifying glass
-
 Comparison chart with four elements, vector eps10 illustration
-
 Analysis blue and red four color minimal icon set
-
 Landing page concept flat isometric illustration. data analysis monitoring team
-
 Infographic design elements with graph and chart
-
 Data science concept with people scenes set in flat design. Women and men analyzing information, scientist working with databases at graphs. Vector illustration visual stories collection for web
-
 Vector infographic chart elements to business data visualization
-
 Big data analysis isometric landing page. Analyst analyzes statistics isometry concept. Business development and optimization 3d web banner. Vector illustration with people characters in flat design
-
 Color Business Graph and Chart Set
-
 Business graph with arrow vector illustration
-
 Confident business woman uses interactive screen makes report to a group of meeting, she shows statistics, growth and analysis. Hand drawn in thin line style, vector illustrations.
-
 Forex stock market investment trading concept, Candlestick pattern with bullish and bearish is a style of financial chart.
-
 Computer Monitor with Voice Graph. Online Business Presentation, Training or Seminar, Virtual Financial Consultation
-
 Stock Market Graph
-
 Tiny Business Characters with Huge Golden Coin near Grow Chart. Investment Strategy and Portfolio Analysis, Investment
-
 Business project, presentation, analysis concept
-
 Businessman holding bar and pie chart. Financial report, marketing, analytics, statistics, research data, business analysis. Flat cute outline cartoon isolated vector illustration
-
 Business Analysis symbol with magnifying glass icon
-
 Financial Graph
-
 Vector illustration concept of data analysis, statistics, business and workflow. Bar chart with tiny working people. Creative design for banner, poster, business presentation.
-
 Green Business Charts and Graphics Set. Vector
-
 Analysis Special lineal color icon. Illustration symbol design template for web mobile UI element. Perfect color modern pictogram on editable stroke.
-
 Graphs and charts vector set
-
 Set Flat 2D concepts Online chat, data analysis, data collection, digital marketing. For Concept for web design
-
 Business concept - retro magnifying glass, data analysis
-
 Flat color Modern Isometric Concept Illustration - Data Analysis
-
 Online Graphs Colored Vector Icon
-
 Lineo Editable Stroke - Diagrams and Graphs line icons
-
 Line Graph Data Presentation Vector Illustration
-
 Set of colored business graphs
-
 Team of professionals engaged in business analysis, young girls with gadgets at work. 3d isometric Concept for web design
-
 Business statistics graph with multiple lines
-
 Business analysis and planning strategy
-
 Research & Analysis Doodle Icons
-
 Business data analysis
-
 Business Analysis symbol with magnifying glass icon and pie chart.
-
 Bar financial data graph. Forex stock crypto currency trading pattern.
-
 Financial administration concept. Consulting for company performance, analysis concept. Statistics and business statement. Flat isometric infographics for banner or business hero images.
-
 Flat design people concept icons isolated on white. Set of vector illustrations for business, strategy, analysis, planning, time management, marketing, startup, business communication, finance, security.
-
 Set of infographic options vector design template. Can be used for workflow layout, data visualization, business concept with 10 options, parts, steps or processes, banner, diagram, chart, web design.
-
 Data analysis icon
-
 Vector growing graph chart background.
-
 Hand doodle charts
-
 Graph chart sign icon. Diagram symbol. Statistics.
-
 Technical Analysis Of Exchange Trade, stock market or stock exchange vector illustration
-
 Candle stick graph chart of stock market investment trading, Bullish point, Bearish point. trend of graph vector design.
-
 Flat isometric concept illustration. business development analysis data
-
 Line graph presenting regression analysis, flat icon image
-
 Sales metrics concept icon. Statistical analysis, analytical marketing research. Business profit rates idea thin line illustration. Vector isolated outline RGB color drawing. Editable stroke
Each vector opens in a new tab with its details. Premium files are sold by Depositphotos; we may earn a commission if you buy. How this works.